An illustrated, interactive guide · Echocardiography

The Heart by Ultrasound.

Ultrasound physics, the standard views, cardiac physiology, hemodynamics, ventricular function and cardiac disease

A transducer sends a short pulse into the chest. The pulse crosses the chest wall, the right ventricle, the septum, the left ventricle and the posterior wall. Echoes return from each boundary. An amplitude (A-mode) trace and a single brightness (B-mode) line display the echoes by depth.
A sector image of the heart is acquired one scan line at a time. A selected artifact is added to the image.
An ultrasound beam intersects flowing blood at an angle. The Doppler display below shows the measured velocity, the Nyquist limit and aliasing.

Planes

Drag to orbit · Click a plane

Cross-section

Parasternal long axis

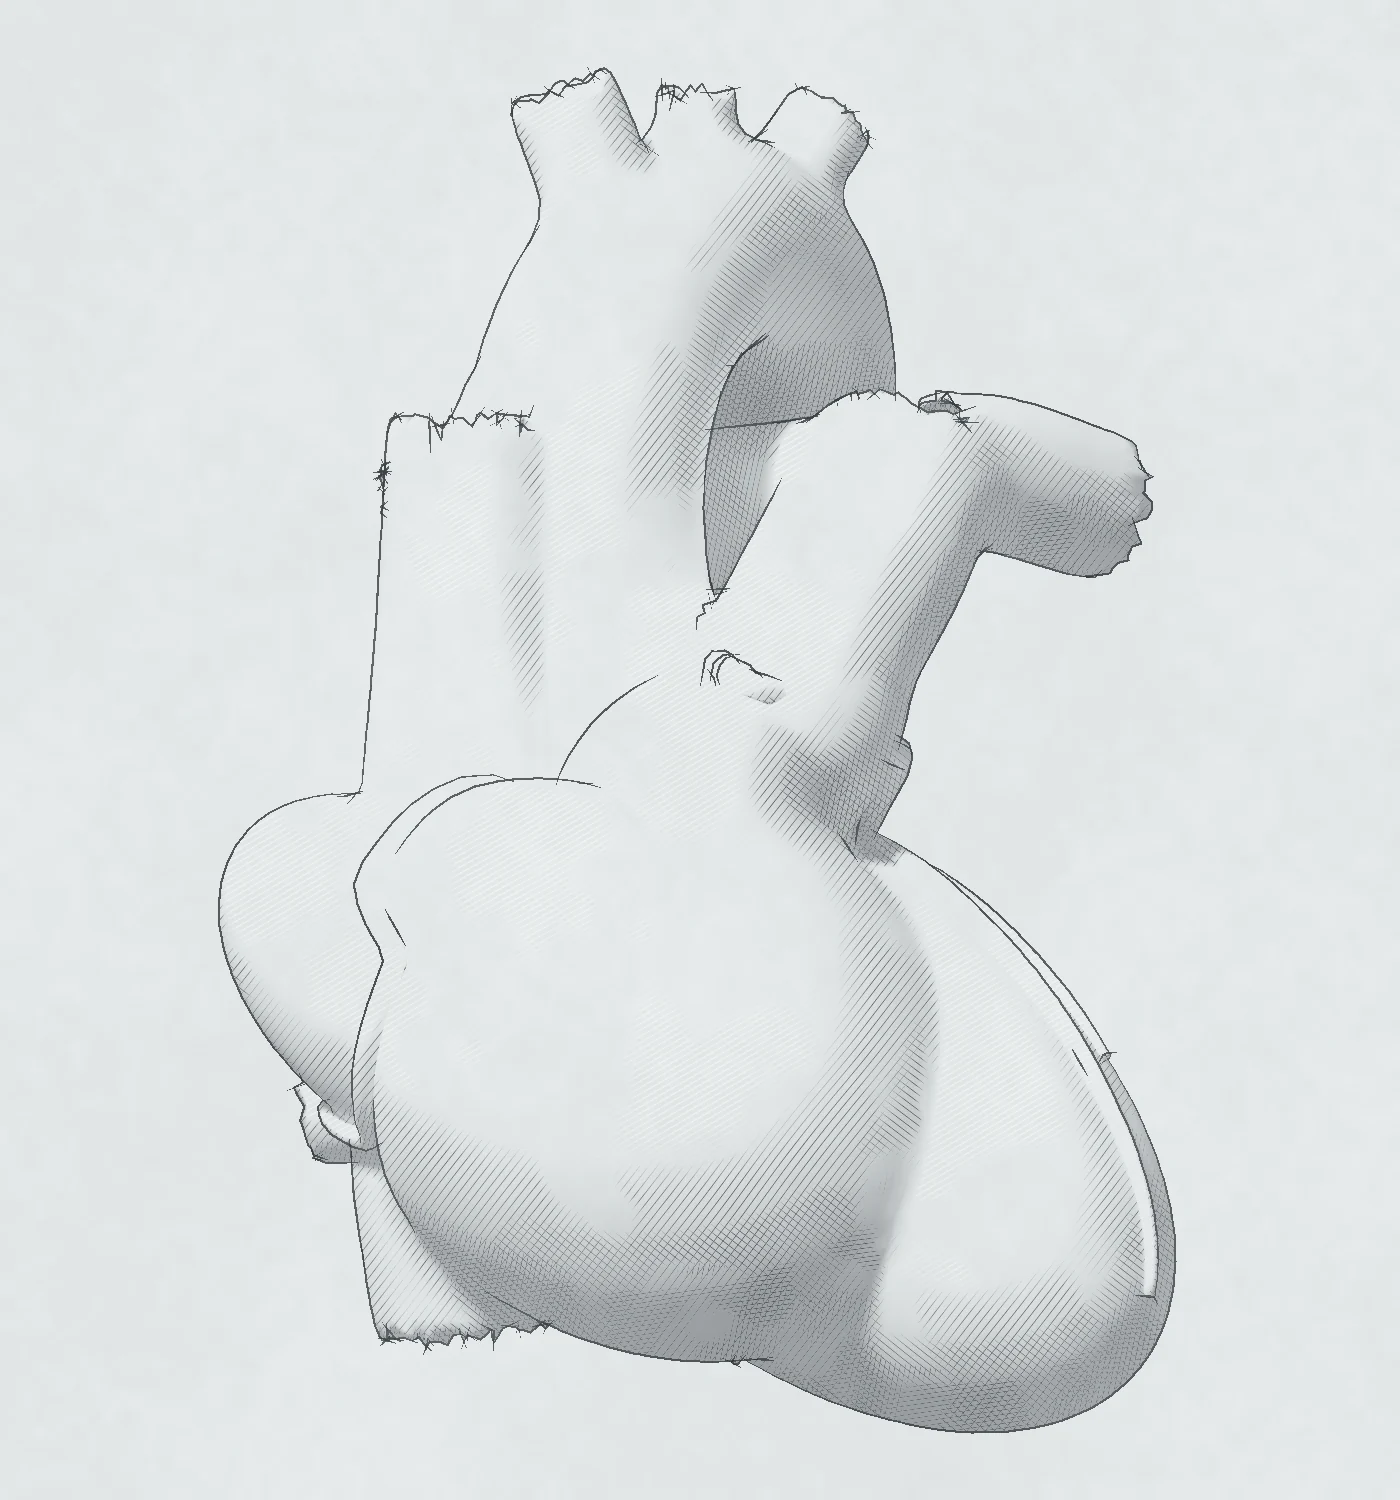
Three views of one imaging plane. Left: a three-dimensional heart with the imaging planes of the nine standard views, each in the color of its acoustic window, and the current plane highlighted; with Probe and body, the whole heart with the probe and a figure of the body instead. Middle: the heart cut in the current plane and seen perpendicular to it, with the structures labeled. Right: the echocardiographic image of the same plane.
Wiggers diagram of one heartbeat: aortic, left ventricular and left atrial pressure, left ventricular volume, the ECG, the heart sounds, mitral inflow and left ventricular outflow Doppler, and an apical four-chamber frame at the chosen moment.
Left ventricular pressure-volume loop with the end-systolic and end-diastolic pressure-volume relations and the arterial elastance line, beside the normal loop.
Two settings. Flow and pressure, at the left: blood flows from the LV outflow tract through the aortic valve into the aorta. The same flow passes every level, so the velocity rises where the area is small, and the pressure falls there and partly rises again in the aorta. Strips under the tube show the flow, the velocity and the pressure along it, and pulsed-wave Doppler before the valve and continuous-wave Doppler through it share one velocity scale. IVC, at the left: the subcostal long axis shows the IVC through the liver into the right atrium, with a caliper 1 to 2 cm from the right atrium, and an M-mode recording shows the IVC through quiet breathing and a sniff, with its largest and smallest diameters. At the right in both settings: right ventricular systolic pressure from the tricuspid regurgitation velocity, as a bar that stacks the pressure difference on the right atrial pressure that the IVC gives.
Apical four-chamber and two-chamber echo views with the left ventricular border traced, its long axis and twenty disks for the biplane method, each above a drawing of the same ventricle divided into the same disks; or, for the right ventricle, TAPSE on M-mode, tricuspid annular velocity and fractional area change.
Occluded artery
Buttons for a normal heart and for an occluded LAD, RCA or circumflex artery. Seventeen-segment bullseye colored by the wall motion score of each segment, with the occluded artery drawn on it, and the apical four-, two- and three-chamber echo views, in which each segment moves according to its score. The numbered segment buttons under the controls change the scores.
Diastolic function from normal to restrictive filling: an apical four-chamber view with the left atrium to scale, mitral inflow, septal and lateral tissue Doppler, pulmonary vein flow, left atrial strain and the tricuspid jet, with the 2025 diastolic algorithm and the path that the current values follow through it.
Cardiac masses from none to large: a left atrial myxoma on a stalk from the atrial septum, which prolapses through the mitral valve in diastole, in the apical four-chamber view and the parasternal long axis, with continuous-wave mitral inflow and its mean gradient; an LV thrombus on an akinetic apex, mural, protruding or mobile, in the apical four-chamber view and the short axis at the apex, with the wall motion of the 17 segments; a papillary fibroelastoma on the aortic side of an aortic cusp, in the parasternal and apical long axes zoomed on the valve. Calipers measure each mass. With an ultrasound enhancing agent the cavities fill, and each mass shows its uptake.
A continuous-flow left ventricular assist device at pump speeds from 4,600 to 6,200 rpm, with a working pump, right ventricular failure, de novo aortic regurgitation or an obstruction of the outflow graft: a parasternal long-axis view with calipers on the left ventricle and color jets of aortic and mitral regurgitation, and an apical four-chamber view with the inflow cannula in the left ventricular apex, the flow into it and the mitral and tricuspid jets, both cut from the heart model; pulsed-wave Doppler at the inflow cannula and continuous-wave Doppler in the outflow graft over three beats, with the artificial pulse every 2 seconds; pulsed-wave Doppler in the right ventricular outflow tract with its velocity time integral and the cardiac output; an M-mode through the aortic cusps over the same three beats; and the left ventricular end-diastolic diameter plotted against the pump speed.
Aortic stenosis from a normal valve to severe stenosis and then low flow: an apical five-chamber view with the LV outflow tract, the thickened and calcified valve, the aortic root and the jet, and the continuous-wave Doppler line through the valve; the continuous-wave trace with the dense LVOT envelope inside the aortic jet and both peak velocities marked; the short-axis valve orifice to scale; and the measurements against their cut-offs.
Aortic regurgitation from mild to severe: a parasternal long-axis view with the color jet in the outflow tract and a dilating left ventricle, the continuous-wave jet with its pressure half-time, flow reversal in the descending aorta, outflow Doppler, and the measurements against their cut-offs.
Mitral stenosis from a normal valve to severe stenosis: an apical four-chamber view with doming leaflets, a large left atrium and the color inflow jet with its flow convergence, the short-axis orifice to scale, continuous-wave mitral inflow with the pressure half-time, the tricuspid jet, and the measurements against their cut-offs.
Mitral regurgitation from mild to severe: an apical four-chamber view with the color jet and flow convergence, the continuous-wave jet, pulmonary vein and mitral inflow Doppler, and the measurements against their cut-offs.
Tricuspid regurgitation from mild to torrential: an apical four-chamber view with the color jet and a dilating right heart, the continuous-wave jet, hepatic vein flow, the inferior vena cava on M-mode, a short-axis view of the septum, and the measurements against their cut-offs.
A prosthetic aortic valve from normal function to significant stenosis, or a normal valve that is small for the patient: a zoomed parasternal long-axis view and a short-axis view of the valve, cut from the heart model, with the sewing ring and the stent and leaflets of a bioprosthesis or the housing and discs of a bileaflet mechanical valve, and the shadow and reverberation behind the metal; continuous-wave Doppler through the valve with its peak velocity, acceleration time and ejection time; pulsed-wave Doppler in the LVOT; and the measurements against their cut-offs.
Diseases of the aorta, for dilation, dissection or coarctation. Dilation, from normal to 6.0 cm at the sinuses and the ascending aorta: the parasternal long-axis view zoomed on the aortic root, cut from the heart model, at end-diastole with leading-edge calipers on the sinuses of Valsalva, the sinotubular junction and the ascending aorta, and at midsystole with an inner-edge caliper on the annulus; the four diameters against their normal ranges; and the diameter thresholds of the 2022 ACC/AHA guideline, for a bicuspid valve under the bicuspid heart. Dissection, from no flap through a reverberation artifact to a flap with aortic regurgitation and a pericardial effusion: the parasternal long-axis view with color, the flap between the true and false lumens, brisk forward flow in the true lumen and slow, late, reversed flow in the false lumen, and a regurgitant jet whose origin and direction follow the flap: central as the root dilates, eccentric from a prolapsed cusp, and beside the flap when it prolapses through the valve; an M-mode of the ascending aorta; and the root zoomed, from one interspace higher. Coarctation, from a mild narrowing to severe coarctation: the suprasternal view of the arch with the narrowing just past the left subclavian artery, its caliper, the color jet and the continuous-wave beam; the subcostal view of the abdominal aorta with its diameter and the pulsed-wave gate; continuous-wave Doppler across the narrowing with the diastolic tail; pulsed-wave Doppler of the abdominal aorta; and the measurements against their cut-offs.
Pericardial disease, with a switch for the disease. Pericardial effusion from none to tamponade: an apical four-chamber view with the fluid around the heart and, in tamponade, collapse of the right atrium and right ventricle; mitral inflow, tricuspid inflow and hepatic vein flow through one respiratory cycle; a parasternal long-axis view with the fluid behind the left ventricle and, in a large effusion, in front of the right ventricle; the inferior vena cava on M-mode; and the measurements against their cut-offs. Constrictive pericarditis from a normal pericardium to severe constriction: an apical four-chamber view with the pericardium at its measured thickness and the septum shifting with each breath; mitral and tricuspid inflow and hepatic vein flow over two breaths with a respiratory trace; tissue Doppler of the medial and lateral mitral annulus; an M-mode of the septum with breathing; the inferior vena cava on M-mode; and the measurements against their cut-offs.
Cardiac amyloidosis from a normal heart to advanced disease: a parasternal long-axis view at end-diastole with calipers on the septum, the cavity and the inferolateral wall, and an apical four-chamber view, both cut from the heart model; mitral inflow and septal tissue Doppler; the 17-segment longitudinal strain bull's-eye; and the measurements against their cut-offs.
Hypertrophic cardiomyopathy from a normal heart to severe obstruction, at rest or with the Valsalva maneuver: a parasternal long-axis view with calipers on the septum, the cavity and the posterior wall at end-diastole and the gap between the anterior mitral leaflet and the septum in systole, and an apical three-chamber view with the color jets in the LV outflow tract and the left atrium, both cut from the heart model; continuous-wave Doppler of the outflow tract and of the mitral regurgitation on one velocity scale; and an M-mode through the mitral valve that shows systolic anterior motion.
Myocardial strain from normal function to severe dysfunction, in a global, a regional or an apical-sparing pattern: the apical four-, two- and three-chamber views cut from the heart model, each with the myocardial midline of speckle tracking in six segments colored by their strain; the strain curves of the chosen view through one beat, with aortic valve closure; the 18-segment bull's-eye with GLS; and the arithmetic of the chosen view's strain, with the relative apical LS in the apical-sparing pattern. Cardio-oncology: a baseline study and a follow-up study during cancer therapy side by side, each with its four-chamber view, LVEF, bull's-eye and GLS, and the result by the ESC 2022 definitions of cancer therapy-related cardiac dysfunction.
View
Buttons for the apical four-, two- and three-chamber views. Dobutamine stress echocardiography as a quad screen: the chosen view at rest, at low dose, at peak and in recovery, each cut from the heart model and beating at the heart rate of its stage, with the segment numbers on its walls colored by their wall motion score. Beside it, the response of each of the 17 segments on a bull's-eye, and the protocol: the dobutamine dose in 3-minute stages, atropine, and the heart rate against its target.
Shunts from none to large, for a secundum atrial septal defect, a perimembranous ventricular septal defect or a patent foramen ovale. Atrial septal defect: a subcostal view of the atrial septum with the defect, its caliper and the left-to-right color jet; an RV-focused apical four-chamber view with the RV and RA size; pulsed-wave Doppler in the RV and LV outflow tracts with their VTIs and diameters for Qp/Qs; and the continuous-wave TR jet with the RV systolic pressure. Ventricular septal defect: a short-axis view at the aortic valve with the defect just below the valve at about 11 o'clock and its jet into the RV; a parasternal long-axis view with the LV diameter; continuous-wave Doppler through the defect with its peak velocity, gradient and the RV systolic pressure; and the two outflow tracts for Qp/Qs. Patent foramen ovale: an apical four-chamber view during an agitated saline study, with the right heart opacified and bubbles crossing into the left atrium, and the number of bubbles in the left atrium beat by beat, at rest and after Valsalva release. LA pressure: a subcostal view of a restrictive 5-mm atrial communication with its left-to-right color jet; the LA and RA pressures over two beats, with their means; and continuous-wave Doppler across the septum, whose peak velocity and traced envelope, with the RA pressure, give the peak and mean LA pressure.
The right ventricle from normal to severe overload, under a pressure or a volume load, or in acute pulmonary embolism: an RV-focused apical four-chamber view with the RV size, wall and FAC, a short-axis view of the septum with the two diameters of the eccentricity index, the continuous-wave TR jet with the RV systolic pressure, pulsed-wave flow in the RV outflow tract with its acceleration time, the M-mode of TAPSE and the tissue Doppler S′. In acute pulmonary embolism the four-chamber view also gives the RV/LV ratio and the free wall's inward motion at its base, middle and apex, with McConnell's sign; the TR jet gives the TR gradient, and the two Doppler traces mark the 60/60 sign when it holds.
Infective endocarditis from a normal mitral valve to a large vegetation with leaflet perforation and severe regurgitation: the parasternal long-axis view zoomed on the valves, with the vegetation on the atrial side of the anterior mitral leaflet and a caliper on its maximal length; the apical three-chamber view with the color jet through the perforation; continuous-wave Doppler through the mitral valve; pulmonary vein flow; and the measurements against their cut-offs.
Mechanical complications of myocardial infarction from none to the end stage, one at a time: a rupture of the apical septum in the apical four-chamber view with its left-to-right color jet, the CW jet across it and the PW velocities of the two outflow tracts for Qp/Qs; a papillary muscle rupture with a flail anterior mitral leaflet, the torn head of the muscle and an eccentric MR jet in the apical three-chamber view, with the CW MR jet and the pulmonary vein flow; a pseudoaneurysm of the inferolateral wall in the parasternal long axis, with calipers on its neck and sac, and the pericardial effusion and the signs of tamponade in the apical four-chamber view; a true apical aneurysm in the apical four- and two-chamber views, with calipers on its mouth and width, a mural thrombus at the end stage, and the wall motion of the 17 segments.
Automated measurement by EchoNet-Measurements, drawn on the site's own images. B-mode: the view of the chosen measurement, cut from the heart model, with a heat map on each end of the caliper, the caliper between their weighted centers and its length on each frame; a close-up of one heat map on its pixels with its weighted center; the conversion from pixels to centimeters; and a trace of the measurement over three beats with end-diastole and end-systole marked and the reported value circled. With the two-peaked map, one heat map has a second peak on a nearby structure and its weighted center falls between the peaks. Doppler and M-mode: the recording of the chosen measurement from its chapter, with a heat map on each peak (two for E and A, two for TAPSE), the baseline, a close-up of one map and the conversion from pixels to velocity or distance. Without the DICOM data, the points remain and the figure gives pixels only.
How EchoPrime and EchoNet-Measurements read one study of the heart shown, in seven steps. EchoPrime: the 14 videos of the study, cut from the heart model, each tagged with its view; one video encoder that turns each video into 512 numbers, drawn as a stripe beside the video's view; the public attention weights of the chosen section, a line from each video to the section as wide as its weight, with the weight at its start, under a strip of the 15 sections; and the chosen section's task heads, of about 150: each number head with its value, ringed where it checks a measurement, then the words of its word heads. EchoNet-Measurements: the nine B-mode measurements, each on its view at the frame that it reports, with its heat maps and its caliper, and the nine Doppler and M-mode measurements on eight recordings, each with its value. Then the measurements of the chosen section beside one band, the heads' range of ± 10%, with a dot for each caliper and its value. Last, the report for the heart, with the words in a serif face and the measured numbers in blue. A click on the strip of sections, a tile or a sentence chooses a section. Arrows link each step to the next. The anchor sits beside the measurements, and the report runs across the foot of the figure. On a small screen, the steps run in more rows, and the figure scrolls.

Probe and plane

Drag to orbit

ME four-chamber

Two views of one transesophageal imaging plane. Left: the three-dimensional heart seen from the patient's left, with the esophagus behind the left atrium, the probe in it at the chosen level, and the imaging plane, which turns with the multiplane angle. Right: the echocardiographic image of the same plane in the guideline's display orientation, with the structures labeled, the view's name, the image depth and an icon of the multiplane angle.

Pulse

The pulse-echo principle

Each scan line of an echocardiographic image is formed from a short ultrasound pulse and the echoes that return from tissue boundaries. The ultrasound system measures the arrival time of each echo and converts it to depth.

Cycles per pulse
Gain

Echo arrival time and depth

The ultrasound system assumes that sound travels at 1540 m/s in all soft tissue. Depth is calculated as speed × time ÷ 2, because the pulse travels to the reflector and back. The round trip takes approximately 13 µs for each centimeter of depth, so the echo from a reflector at 10 cm arrives after approximately 130 µs.

Wavelength and axial resolution

wavelength = speed ÷ frequency  ·  axial resolution = cycles × wavelength ÷ 2

At 7 MHz the wavelength is approximately 0.22 mm. Axial resolution equals half the spatial pulse length, because the echo travels a round trip. A higher transmit frequency or fewer cycles per pulse shorten the pulse, so that two reflectors that lie closer together along the beam are displayed as two separate echoes.

Acoustic impedance and reflection

Acoustic impedance is the product of tissue density and the speed of sound. At each boundary the reflected fraction of the incident intensity is ((Z2 − Z1) ÷ (Z2 + Z1))². A fat–muscle boundary reflects approximately 1.4% of the intensity. A boundary between soft tissue and air reflects almost all of the intensity, so the lung blocks the beam and no image is formed beyond it.

Attenuation and penetration depth

Absorption and scattering in tissue attenuate the pulse, and the attenuation increases approximately in proportion to frequency. The textbook average attenuation coefficient for soft tissue is 0.5 dB per cm per MHz; attenuation is much lower in blood (0.17 dB/cm at 1 MHz) and higher in muscle (1.2 dB/cm). In the figure, the attenuation is summed layer by layer along the beam.

  • Adult transthoracic studies use transmit frequencies of 2.0 to 5.0 MHz.
  • The ASE recommends the highest transmit frequency that still penetrates to the depth of interest.
  • Time gain compensation amplifies the late echoes from deep structures to offset attenuation. It also amplifies the noise.

Key points

  1. Depth is calculated from the echo arrival time; the round trip takes approximately 13 µs per centimeter of depth.
  2. A higher transmit frequency improves axial resolution and reduces the depth of penetration.
  3. Large differences in acoustic impedance at a boundary produce bright echoes. Air and bone block the ultrasound beam.

Image

Image formation and artifacts

A two-dimensional echocardiographic sector image is formed from many scan lines acquired in sequence. Imaging depth, sector width and line density determine the number of frames that the ultrasound system can acquire each second.

Artifact

Frame rate

time per line ≈ 2 × depth ÷ c  ·  time per frame = lines × time per line

The next pulse is transmitted only after the echoes from the deepest point of the current scan line have returned. A greater number of scan lines, a greater depth or more focal zones increase the time required to acquire each frame. In an example in the ASE guideline, a depth of 17 cm with a narrow sector gave 84 frames per second, and a depth of 24 cm with a wide sector gave 43.

The frame rate increases when the depth is reduced, the sector is narrowed, fewer focal zones are used or write zoom is applied. Because the heart moves rapidly, temporal resolution is important in echocardiography.

M-mode repeats a single scan line and displays its echoes against time. Its temporal resolution is far higher than that of a 2D image, so it shows rapidly moving structures best. M-mode measures the IVC (chapter 07) and TAPSE (chapter 09), and it times the RA wall inversion in tamponade (chapter 17).

Lateral resolution

Lateral resolution, the resolution perpendicular to the beam, depends on the beam width. The beam is narrowest at the focus, and lateral resolution is typically 1 to 2 mm. The focus should be placed at the depth of the structure of interest. More scan lines, spaced more closely, improve lateral resolution but lower the frame rate.

Artifacts

The ultrasound system assumes that the pulse travels in a straight line and is reflected only once, that every echo originates on the beam axis, and that each echo returns after a time proportional to the depth of its reflector. Each artifact arises when one of these assumptions is violated.

  • Reverberation. Ultrasound is reflected back and forth between two strong reflectors. Copies of the deeper reflector appear at 2 and 3 times the distance between the reflectors, measured from the shallower reflector.
  • Shadowing. A strong reflector or attenuator, such as a prosthetic ring or calcium, eliminates the echoes from the region behind it.
  • Mirror image. A strong reflector, often the pleura, produces a copy of the structures in front of it at a position behind it.
  • Side lobe. Echoes of off-axis energy from a strong reflector are displayed as if they originated in the main beam, often as an arc.

Harmonic imaging forms the image from echoes at twice the transmit frequency and is recommended by the ASE. It reduces side-lobe artifacts, but it can make valve leaflets appear thicker.

Key points

  1. The frame rate equals 1 ÷ (number of scan lines × time per line).
  2. A reduction in imaging depth and sector width increases the frame rate.
  3. Each artifact can be identified from the assumption of image formation that it violates.

Doppler

The Doppler effect

Doppler echocardiography measures blood velocity from the frequency shift of the returning echoes. The angle between the beam and the direction of flow, together with the Nyquist limit, determines the velocity that the ultrasound system can report.

Mode

The Doppler equation

Δf = 2 × f0 × v × cos θ ÷ c

Flow toward the transducer produces a positive frequency shift, and flow away from the transducer produces a negative shift. The speed of sound in the equation is c = 1540 m/s. For a blood velocity of approximately 1 m/s and transducer frequencies in the MHz range, the shift is a few kHz, which lies within the audible range.

Beam angle to the flow

Cardiac Doppler measurement assumes that the beam is parallel to the flow (θ = 0). An angle of 20° between the beam and the flow underestimates the velocity by only approximately 6%. At 60° the ultrasound system reports half the true velocity (by calculation, cos 60° = 0.5). The ASE does not recommend angle correction; the beam should be aligned with the flow, several windows should be used, and the highest velocity should be reported.

Pulsed-wave Doppler and the Nyquist limit

Pulsed-wave (PW) Doppler measures velocity at a single depth, but the echo from each pulse must return before the next pulse is transmitted. The depth of the sample volume therefore determines the pulse repetition frequency (PRF), and the highest velocity that can be measured without aliasing is c² ÷ (8 × depth × f0). The Nyquist limit is PRF ÷ 2; flow faster than this limit wraps around to the opposite side of the baseline.

  • A sample volume closer to the transducer or a lower Doppler frequency increases the Nyquist limit.
  • High-PRF Doppler adds sample volumes to increase the Nyquist limit but introduces range ambiguity.
  • Continuous-wave (CW) Doppler has no Nyquist limit but provides no depth information.

Color Doppler

Color Doppler displays the mean velocity at many sample volumes, with flow toward the transducer in red and flow away from the transducer in blue. Because color Doppler is a pulsed technique, it is also subject to aliasing. The ASE suggests a velocity scale of 50 to 70 cm/s for routine color Doppler imaging and approximately 30 cm/s for low-velocity flow. A small, shallow color box maintains a high frame rate.

Spectral broadening does not always indicate turbulent flow; a large sample volume or a high gain setting also broadens the spectrum.

Tissue Doppler

Tissue Doppler measures the velocity of the myocardium and of the mitral and tricuspid annulus. Tissue moves slowly, below 20 cm/s, but returns strong echoes, so tissue Doppler uses its own filter settings and a velocity scale below 25 cm/s. From the apical window, it records the systolic (s′), early diastolic (e′) and late diastolic (a′) velocities of the annulus. Chapter 09 uses the tricuspid S′ for RV function, and chapter 11 uses the mitral e′ for diastolic function.

Key points

  1. The measured velocity equals the true velocity × cos θ, where θ is the angle between the beam and the flow.
  2. A deeper sample volume or a higher Doppler frequency lowers the Nyquist limit.
  3. High velocities should be measured with continuous-wave Doppler.

Views

Acoustic windows and imaging planes

Each standard transthoracic view is a single imaging plane through the heart. The plane is determined by the position of the probe, the rotation of its marker and the tilt of the beam.

Window
View [ and ] step through all

Acoustic windows

The ASE guideline describes four acoustic windows: parasternal, apical, subcostal and suprasternal notch. Parasternal and apical imaging is performed with the patient in the left lateral decubitus position, and subcostal and suprasternal imaging with the patient supine.

  • Parasternal long axis. The probe is placed in the third or fourth left intercostal space, with the marker toward the right shoulder at 9 to 10 o’clock.
  • Parasternal short axis. The probe is rotated 90° clockwise from the long-axis position, so that the marker points to the left shoulder. The beam is then tilted inferiorly to move the plane from the great vessels to the mitral valve and the papillary muscles; for the apical level, the probe is moved one or two intercostal spaces lower and more laterally.
  • Apical window. The probe is placed at the apical impulse, with the marker at 4 to 5 o’clock. From the four-chamber view, the two-chamber view is obtained by a counterclockwise rotation of about 60°, and the three-chamber view by a further 60°. The five-chamber view is obtained by tilting the beam anteriorly.
  • Subcostal window. The probe is placed below the xiphoid. The subcostal views show the heart, the pericardium, the RV free wall and the inferior vena cava (IVC); with the beam angled slightly to the patient's left, they show the abdominal aorta. Chapter 07 measures the IVC and distinguishes it from the aorta.
  • Suprasternal window. The suprasternal views show the ascending aorta, the aortic arch, the head vessels and the descending aorta.

Moving the probe

The ASE guideline defines the transducer movements. To rotate is to turn the index marker to a new position, with the transducer in the same place. To tilt is to move the face of the transducer, with the transducer fixed in position, to show other imaging planes in the same axis. To rock is to move the transducer toward or away from the orientation marker, within the same imaging plane. Rocking centers a structure or extends the field of view. To slide is to move the transducer over the skin to a new position. To angle is to direct the beam toward a structure from the same position, and it combines several small movements.

The interactive figure

The left panel shows the whole heart from the front, with the imaging planes of the nine standard views, each in the color of its acoustic window. The current plane is highlighted, with the lines along which it intersects the other planes. Selecting a plane displays its view. The Probe and body option replaces the planes with the current plane and the probe, and with a small figure of the body, oriented as the heart is, with the probe on the skin at the acoustic window, the heart within the chest, the head and the patient's left side. The middle panel shows the heart model sectioned in the imaging plane and viewed perpendicular to that plane, in the orientation of the echocardiographic image. The Labels option displays the names of the structures on the model. The right panel shows the echocardiographic image of the same plane through the model. When another view is selected, the plane moves from its current position, as the probe would move.

The Free probe option moves the probe away from the standard views. Five sliders move it from the view above, in the guideline's terms. Rotate turns the probe about its beam, clockwise as the examiner sees it. Tilt turns the beam across the imaging plane. Rock turns the beam within the plane, toward or away from the marker. Slide along moves the probe over the chest toward or away from the marker, and Slide across moves it at a right angle to the plane. The three panels follow the moved plane. The panel of the sliders names the standard view nearest the plane. It gives the angle between the two beams, the angle between the two markers, and the distance from the probe to that view's beam. Within 5° and 0.5 cm it names the plane as that view. A drag that stops there settles the probe on the view, and the sliders go back to zero. Angling has no slider, because it combines the other movements. The button under the sliders brings the probe back to the starting view.

The model builds each view on its own, so one move of the guideline gives the plane of the next view, but not always its aim or its place. On the normal heart, a 90° clockwise rotation from the long axis gives a plane within 4° of the short axis at the mitral valve. The beam of that view aims 29° away, and the rotated probe lies 3.8 cm from that view's beam. From a neighbouring view, the five sliders together reach each standard view.

Below the diaphragm, the liver, the IVC, two hepatic veins, the abdominal aorta with the celiac trunk and the superior mesenteric artery, and the spine are simple shapes added for the subcostal views. These structures are not part of the heart model, and only the liver appears in the 3D view. Each view is labeled with its view class name for image annotation, where the annotation list contains the view. The model is a normal adult heart; in a patient, the angles vary with the position of the heart.

Apical foreshortening

In an apical view through the true apex, the LV occupies about two thirds and the LA about one third of the long axis; a shorter, rounder LV indicates a foreshortened view (chapter 09).

The minimum dataset of the British Society of Echocardiography lists the views in scanning order and specifies at least two cardiac cycles for each clip.

Key points

  1. The parasternal short-axis view is obtained by rotating the probe 90° clockwise from the parasternal long-axis view.
  2. The apical two-chamber and three-chamber views are obtained from the four-chamber view by successive counterclockwise rotations of about 60°.
  3. The five-chamber view is obtained by tilting the beam anteriorly from the four-chamber view.

Planes

The standard imaging planes

Each standard view is a plane through the same heart. Displayed together, the planes show which views intersect along a common line, which views are parallel and which views contain a given structure.

View sets
Views click: add, focus, remove
Find a structure
Viewpoint

Spatial relations of the views

  • The apical planes intersect along the LV long axis. The apical four-, two- and three-chamber planes all contain the long axis of the LV. According to the ASE guideline, the probe is rotated about 60° between these views; the angles of this model are given in the figure. Viewed from the apex, the three planes radiate from the long axis.
  • The short-axis planes are nearly parallel. Tilting the probe moves the plane in steps from the mitral valve level to the papillary muscle level and the apex. Viewed from the side, the planes form a stack.
  • The long- and short-axis planes are perpendicular. The parasternal short-axis view is obtained by a 90° rotation of the probe from the parasternal long-axis view.
  • Small tilts produce additional views. From the parasternal long-axis view, a tilt toward the right hip produces the RV inflow view, and an anterior tilt produces the RV outflow view. From the apical four-chamber view, an anterior tilt brings the LVOT and the aortic valve into the plane.

Free plane

The Free plane controls move a plane away from the focused view in the same ways that a probe is moved: rotation about the beam, tilt of the beam across the plane, rock of the beam within the plane, slide of the probe along the plane and sweep of the probe across it. The echocardiographic image displays the section that this plane cuts from the heart, and the En face viewpoint turns the 3D heart so that the plane is viewed perpendicular to its surface. In this model, a rotation of 60° counterclockwise from the four-chamber view produces the two-chamber view, and a rotation of 120° produces the three-chamber view. A rotation of 90° clockwise from the parasternal long axis produces the short axis at the mitral valve level.

The probe remains in the acoustic window of the focused view, so the free plane is compared only with the standard views of that window. A plane from another window can cut the heart in almost the same section, as the apical and subcostal four-chamber planes do, but it constitutes a different view. The comparison uses the angle between the planes, with the orientation marker on the same side, and the distance of the view's center from the free plane. The same plane with the marker on the opposite side produces a mirror image, and the free-plane panel reports the reversed marker. Within 20° and 3 cm, the nearest view is marked; within 10° and 1.5 cm, the plane settles onto that view when the control is released.

Back to the focused view returns the probe to the focused view in steps: slide and sweep first, then tilt and rock, and rotation last. Each step begins before the previous step ends, so the movement is continuous. Go to a view moves the free plane to any standard view. For a view in the same window, the selected view becomes the focused view; the control values are then recalculated relative to that view and return to zero. For a view in another window, the probe first returns to the focused view and then moves across the chest to the new window.

Structures in each view

The table lists the structures that the ASE guideline names for each displayed view. Selection of a structure highlights the views that contain it. The figure shows only the parent views, not their zoomed or LV-focused variants.

Clinical relevance

  • A finding should be confirmed in two views that intersect it at different angles.
  • Some measurements combine two views of the same site; the LVOT diameter (zoomed parasternal long-axis view) and the LVOT velocity (apical five-chamber view) must be obtained at the same level.
  • Each apical view shows two opposite walls of the LV, and together the three apical views include all 17 segments.

Key points

  1. The apical four-, two- and three-chamber planes are related by rotation about the LV long axis.
  2. The parasternal short-axis planes are nearly parallel sections through the heart.
  3. Each structure appears in several views and should be examined in at least two of them.

Cycle

The cardiac cycle

Mitral and aortic valve opening and closure divide the cardiac cycle into isovolumic contraction, ejection, isovolumic relaxation and filling. Echocardiography times each event from the ECG, from valve motion and from Doppler flow.

The Wiggers diagram

The Wiggers diagram plots LV pressure, LV volume, LA pressure and aortic pressure against time and marks mitral and aortic valve opening and closure. Mitral valve closure coincides with the first heart sound (S1), and aortic valve closure coincides with the second heart sound (S2). Electrical events precede mechanical events; for example, the QRS complex precedes ventricular contraction.

Phase durations

In 1,969 healthy adults, the isovolumic contraction time is 40 ± 10 ms, the ejection time 292 ± 23 ms and the isovolumic relaxation time 96 ± 19 ms. The model in the figure uses these mean values at a heart rate of 70 beats per minute. The isovolumic relaxation time increases with age.

Echocardiographic timing

  • End-diastole is the first frame after mitral valve closure or the frame with the largest LV dimension; the QRS complex or the R wave can be used instead.
  • End-systole is the frame at or after aortic valve closure and lies near the end of the T wave.
  • In the mitral inflow velocity recording, the E wave peaks after the T wave, and the A wave occurs after the P wave.
  • IVRT extends from the end of LVOT flow to the onset of mitral inflow. It is recorded with CW Doppler through the LVOT in the apical five-chamber or apical long-axis view, so that the LVOT outflow and mitral inflow signals are displayed together.

IVRT lengthens with age, so a single normal value should not be applied across all ages. Chapter 11 uses a short IVRT as a sign of a raised LA pressure.

Most of the LV filling volume enters during early diastolic filling; atrial contraction contributes the remainder, about one fifth of the filling volume in the example of Mitchell and Wang.

Key points

  1. Mitral valve closure coincides with S1, and aortic valve closure coincides with S2.
  2. End-diastole is the first frame after mitral valve closure, and end-systole is the frame at or after aortic valve closure.
  3. IVRT is measured from the end of LVOT flow to the onset of the mitral E wave.

Loop

LV pressure–volume analysis

The LV pressure–volume loop plots LV pressure against LV volume over one cardiac cycle. Changes in contractility, afterload and chamber stiffness alter the position and shape of the loop and change the ejection fraction.

Heart

Phases of the loop

The loop is traversed counterclockwise through the four phases of the cardiac cycle (chapter 05): isovolumic contraction, ejection, isovolumic relaxation and filling. The width of the loop is the stroke volume, and its area is the stroke work.

ESPVR, EDPVR and arterial elastance

  • ESPVR. The end-systolic pressure–volume points lie on a nearly straight line, P = Ees × (V − V0). Its slope, Ees, is a relatively load-independent measure of contractility.
  • EDPVR. The end-diastolic pressure–volume relation is curvilinear and close to exponential, and it describes the passive stiffness of the chamber.
  • Ea. Effective arterial elastance is end-systolic pressure ÷ stroke volume, which equals the absolute value of the slope of the line from the EDV on the volume axis to the end-systolic point.

Ventricular–arterial coupling and ejection fraction

EF = Ees ÷ (Ees + Ea)  (with V0 taken as 0)

EF depends on both the ventricle and its load and is therefore not a pure measure of contractility. An increase in afterload decreases EF even when contractility is unchanged. Stroke work is maximal when Ea equals Ees, and efficiency is highest at a lower Ea/Ees. In healthy adults at rest, Ea/Ees is about 0.5 to 1.0, depending on the method of measurement.

Without invasive pressure measurement, end-systolic pressure is often estimated as 0.9 × the systolic cuff pressure.

Preset conditions

  • Hypocontractile ventricle (HFrEF). With a low Ees, the ventricle dilates and ejects a small fraction of its end-diastolic volume.
  • Stiff ventricle (HFpEF). With a steep EDPVR, filling pressure is high at a normal volume, and EF remains normal.
  • Pressure load. With a high Ea, as in aortic stenosis or hypertension, the loop rises to a high systolic pressure.
  • Volume load (MR). This preset reproduces the loop of the Barlow MR heart, with chronic severe primary mitral regurgitation (chapter 15). The loop is wide and shifted to the right; EDV is much larger, and EDP is only slightly higher. The LV ejects into the LA from the onset of contraction, so there is no isovolumic contraction, and the mitral valve opens early. Only part of the stroke volume is ejected forward into the aorta.

Preload is the stretch of the myocardium before contraction, and afterload is the load against which the ventricle ejects.

Key points

  1. Ees, the slope of the ESPVR, is an index of contractility.
  2. Effective arterial elastance is calculated as Ea = end-systolic pressure ÷ stroke volume.
  3. EF depends on both Ees and Ea, as EF = Ees ÷ (Ees + Ea).
  4. In chronic severe mitral regurgitation, the loop has no isovolumic contraction phase and is wide and shifted to the right.

Doppler hemodynamics

Flow, pressure and the IVC

Almost every echocardiographic report includes Doppler calculations of flow and pressure. The same flow passes every level of the outflow: where the area falls, the velocity rises and the pressure falls. RV systolic pressure is 4 × (peak TR velocity)² plus the RA pressure estimated from the IVC.

Show
RA pressure, from the IVC

Flow is the same at every level

flow rate = area × velocity  ·  A₁ × V₁ = A₂ × V₂

Blood does not compress, so in each instant the same flow passes every level of the outflow: the LV outflow tract, the aortic valve and the aorta. The flow rate through an orifice equals the area of the orifice multiplied by the velocity of the blood in it. Where the area is small, the velocity is high: an orifice with a quarter of the area carries the same flow at four times the velocity. For a given orifice area, the velocity and the gradient increase with the flow rate and decrease when it falls.

The volume that passes in one beat equals the area multiplied by the VTI, and it is the same at each level: the stroke volume ejected through the LV outflow tract all passes through the aortic valve. The continuity equation uses this: the aortic valve area equals the LVOT area multiplied by the LVOT VTI and divided by the aortic VTI. Chapter 12 calculates the valve area in this way. The velocity ratio, the LVOT velocity divided by the aortic velocity, gives the valve area as a fraction of the LVOT area without the LVOT diameter. It approaches 1 without stenosis, and a ratio of 0.25 or less suggests severe stenosis.

Stroke volume from the LVOT

Stroke volume is the LVOT area multiplied by the LVOT VTI. The LV outflow tract is assumed to be circular, so its area is 0.785 × d², with the diameter d in cm. The LVOT diameter is measured in a zoomed parasternal long-axis view from inner edge to inner edge in mid-systole. The LVOT velocity is recorded with pulsed-wave Doppler from the apical five-chamber or apical long-axis view, with the sample volume just below the aortic valve. Both measurements should be made at the same level.

Because the diameter is squared, a small error in its measurement produces a large error in the calculated stroke volume. Repeated LVOT diameter measurements vary by 5 to 8%, which is the largest source of error in the continuity equation. A 2 mm error in the diameter of a 2.0 cm outflow tract changes the calculated stroke volume by approximately 20%.

Normal resting values from catheterization studies are a stroke volume of 60 to 100 mL, a cardiac output of 4 to 8 L/min and a cardiac index of 2.5 to 4.0 L/min/m².

Pressure falls where velocity rises

ΔP = 4 (V₂² − V₁²) ≈ 4 V₂²

As the blood speeds up into a narrow orifice, pressure is converted into velocity, and the pressure is lowest at the vena contracta, the narrowest part of the jet. The simplified Bernoulli equation calculates the pressure difference in mmHg from the velocity in m/s. It assumes that viscous losses and acceleration are negligible and that the velocity proximal to the narrowing can be ignored. When the proximal velocity is over 1.5 m/s, or the jet velocity is under 3.0 m/s, the proximal velocity is included: ΔP = 4 (V₂² − V₁²).

Past the orifice, the jet slows in the aorta. Part of its kinetic energy is lost as heat in turbulence, and the rest is converted back into pressure, which rises again: this is pressure recovery. The recovered pressure equals 4V² × 2 EOA/AoA × (1 − EOA/AoA), where EOA is the effective orifice area and AoA is the area of the ascending aorta. Doppler measures the pressure drop from the LV to the vena contracta, while a catheter measures the net drop from the LV to the aorta. In most adults with aortic stenosis the recovery is small, but when the ascending aorta is narrower than 30 mm, the Doppler gradient can be significantly higher than the net gradient.

The maximum gradient is the maximum instantaneous pressure difference across the valve. The mean gradient is the average of the instantaneous gradients over ejection, and it cannot be calculated from the mean velocity.

Flow convergence (PISA)

Blood accelerates toward a regurgitant orifice in roughly hemispheric shells. Color Doppler shows the shell at the aliasing velocity (chapter 03), and the flow rate through the orifice is the area of that shell × the aliasing velocity. Chapter 15 derives the effective regurgitant orifice area (EROA) and the regurgitant volume from it, and chapter 16 applies it to TR.

The vena contracta of a regurgitant jet is its narrowest part, at or just downstream of the orifice. It is slightly smaller than the anatomic orifice, and its cross-sectional area is a measure of the EROA. The regurgitant fraction is the regurgitant volume divided by the stroke volume through the regurgitant valve.

Pressure gradients and RV systolic pressure

RVSP = 4 × (peak TR velocity)² + RA pressure

The peak TR velocity gives the pressure difference between the RV and the RA, and the RA pressure estimated from the IVC is added to obtain the RV systolic pressure.

Without RV outflow obstruction, pulmonic stenosis or proximal PA stenosis, the RV systolic pressure equals the PA systolic pressure. In significant TR, the RV and RA pressures can equalize early; the CW signal then becomes triangular and underestimates the RV–RA gradient (chapter 16). A faint TR signal also underestimates it.

A resting peak TR velocity of 2.9 m/s or more, or of 2.8 m/s or more with two other echocardiographic signs, suggests pulmonary hypertension. An IVC wider than 2.1 cm is one of those signs. Chapter 13 shows the RV's response to a pressure load: its size, wall, function and septum.

RA pressure from the IVC

In the subcostal long axis, the caliper crosses the IVC perpendicular to its long axis, 1 to 2 cm from the RA, at end-expiration, where the diameter is usually largest. A second recording follows the IVC through a sniff. The collapse is the fall in diameter, as a percentage of the expiratory diameter. M-mode measures the diameter and its change with breathing more accurately than 2D imaging. Its line must cross the IVC at a right angle: an oblique line overestimates the diameter.

The 2025 ASE guideline gives the RA pressure as one of three values:

  • 3 mmHg (range 0–5): IVC ≤2.1 cm with ≥50% collapse.
  • 8 mmHg (range 5–10): IVC ≤2.1 cm with <50% collapse, or IVC >2.1 cm with ≥50% collapse.
  • 15 mmHg (range 10–20): IVC >2.1 cm with <50% collapse.

The two mixed patterns are indeterminate. Secondary signs of a raised RA pressure then decide: RA enlargement, an atrial septum that bulges into the LA throughout the cardiac cycle, a restrictive right-sided diastolic filling pattern, a tricuspid E/e′ ratio >6 and a hepatic vein systolic filling fraction <55%. With none of these signs, the estimate falls to 3 mmHg. With signs present, it rises to 15 mmHg. If uncertainty remains, the estimate is 8 mmHg.

A value of 20 mmHg can be considered when the IVC is wider than 2.5 cm and collapses less than 50%, with dilated hepatic veins. When the patient cannot sniff, the collapse with quiet breathing replaces the sniff, with a cut-off of 20%.

Normally, hepatic vein S is larger than D. A raised RA pressure lowers S/D below 1, and a systolic filling fraction, S/(S + D), below 55% is a sensitive and specific sign of it. In severe TR, S reverses (chapter 16).

The IVC runs on the right side of the spine, within the liver, and the hepatic veins drain into it. The aorta lies in the midline, apart from the liver, and does not change with respiration.

Pitfalls of the IVC

  • Positive-pressure ventilation. The collapse of the IVC does not estimate the RA pressure. If the RA pressure is clinically relevant, an invasive measurement should replace the estimate. Secondary signs can show whether it is normal or raised. If uncertainty remains, the estimate is 8 mmHg.
  • Athletes, young adults and pregnancy. A dilated IVC can be normal in athletes and healthy young adults and is common in pregnancy.
  • Raised intra-abdominal pressure. It can collapse the IVC despite a raised RA pressure.

Key points

  1. The same flow passes every level, so where the area falls, the velocity rises and the pressure falls: ΔP = 4 (V₂² − V₁²), simplified to 4V₂² when the proximal velocity is small.
  2. Past the valve, part of the pressure returns as the jet slows (pressure recovery); with an ascending aorta under 30 mm, the Doppler gradient can exceed the net gradient.
  3. Stroke volume equals the LVOT area × the LVOT VTI, and an error in the LVOT diameter is squared in the calculation.
  4. RV systolic pressure equals 4 × (peak TR velocity)² plus the RA pressure estimated from the IVC.
  5. The IVC, measured 1 to 2 cm from the RA at end-expiration, gives 3 mmHg when it is ≤2.1 cm and collapses ≥50% with a sniff, 15 mmHg when it is >2.1 cm and collapses <50%, and 8 mmHg in the mixed patterns unless secondary signs decide.
Systolic function

LV volumes, LVEF and strain

LVEF is the fraction of the end-diastolic volume that the LV ejects. It is measured from the LV volumes traced in the apical four- and two-chamber views.

Frame

Biplane method of disks

The biplane method of disks (modified Simpson’s rule) is the recommended 2D method; 3D echocardiography should be used when it is available and image quality is good. The LV is traced at end-diastole and end-systole, the frames that chapter 05 defines, in the apical four- and two-chamber views. The software divides the LV into a stack of thin disks and sums their volumes. LV volumes should not be calculated from linear dimensions.

The border is traced at the interface between the compacted myocardium and the cavity and is closed by a straight line across the mitral annulus. The LV length, L, is measured from the midpoint of that line to the most distant point of the border, and the longer L of the two views is used. In the figure, each echocardiographic view displays its tracing, L and the 20 disks; the drawing below each view shows the model LV in the plane of that view.

Foreshortening of the apical views (chapter 04) leads to underestimation of the LV volumes. An imaging depth set on the LV reduces the likelihood of foreshortening. In a foreshortened view, the apex has a more rounded contour. In the figure, foreshortening reduces both volumes by the same fraction, so the EF changes little although both volumes are underestimated.

Normal values

  • Normal LVEF is 52–72% in men and 54–74% in women. LVEF is mildly abnormal at 41–51% in men and 41–53% in women, moderately abnormal at 30–40% and severely abnormal below 30%.
  • The EDV index is normal at 34–74 mL/m² in men and 29–61 mL/m² in women, and the ESV index at 11–31 mL/m² in men and 8–24 mL/m² in women.
  • The heart failure categories by LVEF are reduced (≤40%), mildly reduced (41–49%) and preserved (≥50%).
  • The valve chapters define LV dysfunction by other LVEF cut-offs: below 50% in aortic stenosis (chapter 12), 55% or less in aortic regurgitation (chapter 13) and 60% or less in mitral regurgitation (chapter 15).
  • Global longitudinal strain is normal when more negative than −18%, borderline from −16% to −18% and abnormal when less negative than −16%. GLS varies between vendors and software versions, so serial studies of one patient should use the same equipment and software.

The ASE reporting guideline describes global LV systolic function as normal, hyperdynamic or reduced, with a grade of the reduction. A single LVEF should be reported, together with the method of measurement. In serial 2D studies of stable patients, the EF varied by more than 10 percentage points; with non-contrast 3D echocardiography, it varied by about 6 percentage points.

RV systolic function (TAPSE, S′ and the fractional area change) is in chapter 13.

Key points

  1. LV volumes are measured by the biplane method of disks in the apical four- and two-chamber views, and foreshortening should be avoided.
  2. The lower limit of normal LVEF is 52% in men and 54% in women.
  3. Global longitudinal strain is abnormal when it is less negative than −16%.

Regional wall motion

The 17-segment model

In the standard model, the LV wall is divided into 17 segments. Each coronary artery usually supplies a specific set of segments, so the distribution of abnormal wall motion indicates the artery involved.

Wall motion of the affected segments
Each segment: tap for the next score

Segment nomenclature

The segments are named counterclockwise from the anterior junction of the septum and the RV free wall: anteroseptal, inferoseptal, inferior, inferolateral, anterolateral and anterior. The basal and mid levels each contain six segments, the apical level contains four, and the apical cap is segment 17.

  • Wall motion should be scored in 16 segments, and 17 segments should be used for perfusion or for comparison with other imaging modalities.
  • Each segment is scored as follows: 1, normal or hyperkinetic; 2, hypokinetic; 3, akinetic; 4, dyskinetic. The 2025 reporting guideline adds a score of 5 for an aneurysmal segment. In the figure, a tap on a segment in the bull's-eye or in an apical view, or on its numbered button, advances that segment to the next score.
  • The wall motion score index is the mean of the segment scores, and a value of 1.00 is normal.

Apical views and LV walls

The apical four-chamber view shows the inferoseptal and anterolateral walls, the two-chamber view the inferior and anterior walls, and the three-chamber view the inferolateral and anteroseptal walls.

Wall motion patterns of coronary occlusion

  • LAD. LAD occlusion affects the anterior wall in the two-chamber view and the anteroseptal wall in the three-chamber view, each from base to apex; the apical septum in the four-chamber view; and the apex in all three views.
  • RCA. RCA occlusion affects the inferior wall in the two-chamber view, from base to apex, and the basal and mid inferoseptum in the four-chamber view; the three-chamber view remains normal.
  • Circumflex. Circumflex occlusion affects the anterolateral wall in the four-chamber view and the inferolateral wall in the three-chamber view; the two-chamber view remains normal.

Coronary territories

In the standard map, the LAD supplies segments 1, 2, 7, 8, 13, 14 and 17; the right coronary artery supplies segments 3, 4, 9, 10 and 15; and the circumflex supplies segments 5, 6, 11, 12 and 16. Coronary supply varies between patients; in one CT study, 72% of patients had at least one segment supplied by a different artery. The map should therefore be regarded as a guide rather than a fixed rule.

Regional strain values are not recommended for clinical decision-making, because they vary between repeated examinations and between vendors.

Key points

  1. Wall motion is scored in 16 segments, and the wall motion score index is the mean of their scores.
  2. Each apical view shows two opposite walls of the LV.
  3. Abnormal motion of the anterior wall, the anteroseptum and the apex suggests LAD occlusion. Abnormal motion of the inferior wall and the basal and mid inferoseptum suggests RCA occlusion, and abnormal motion of the lateral walls suggests circumflex occlusion.

Diastolic function

Filling and LA pressure

LV diastolic function determines the LA pressure that is required to fill the LV. As LV relaxation slows and the LV then stiffens, the mitral inflow, the annular velocities, the pulmonary venous flow and the LA change together. The 2025 ASE algorithm classifies the LA pressure and grades diastolic dysfunction.

Grades of diastolic dysfunction

  1. In grade 1 diastolic dysfunction, LV relaxation is slowed; e′ decreases, and E/A decreases to 0.8 or less. E/e′ and the PA pressure remain normal, and the LA pressure is therefore normal.
  2. In grade 2, the LA pressure is mildly to moderately raised and E/A remains below 2, so the mitral inflow can appear normal again, a pattern termed pseudonormal. E/e′ and the peak TR velocity increase, the pulmonary vein S/D ratio decreases to 0.67 or less, and LA reservoir strain decreases to 18% or less.
  3. Grade 3 is defined by a markedly raised LA pressure with E/A ≥2, the restrictive filling pattern. In patients with a normal LVEF, a restrictive pattern with a dilated LA is associated with a poor prognosis.

The values in the figure are illustrative. In patients with a normal LVEF, the pulmonary vein S/D ratio can remain above 0.67 although the filling pressures are high; an LA reservoir strain ≤18% is specific for a raised LA pressure, but a higher strain does not exclude it.

Doppler variables

  • The mitral inflow E and A velocities represent early diastolic filling and atrial filling (chapter 05). Slow LV relaxation reduces early filling relative to atrial filling, so E/A decreases.
  • The early diastolic velocity of the mitral annulus, e′, is measured with tissue Doppler. It depends directly on LV relaxation and is therefore the first variable in the algorithm.
  • The ratio E/e′ increases with LA pressure. In an early study, lateral E/e′ correlated with the pulmonary capillary wedge pressure (r = 0.87).
  • In the absence of lung or pulmonary vascular disease, a peak TR velocity of 2.8 m/s or more supports a raised LA pressure.

The 2025 ASE algorithm in sinus rhythm

  1. Step 1 assesses three variables: reduced e′ (septal ≤6, lateral ≤7 or average ≤6.5 cm/s); raised E/e′ (septal ≥15, lateral ≥13 or average ≥14); and a peak TR velocity ≥2.8 m/s, or a PA systolic pressure ≥35 mmHg (chapter 08) when the RA pressure is known. Chapter 07 estimates the RA pressure from the IVC.
  2. Step 2 depends on which step 1 variables are abnormal. If all three are normal, the LA pressure and diastolic function are normal. If reduced e′ alone is abnormal and E/A is ≤0.8, the LA pressure is normal, with grade 1 diastolic dysfunction. In a symptomatic patient with a normal LA pressure at rest, diastolic exercise echocardiography is recommended. If all three are abnormal, the LA pressure is raised. Reduced e′ alone with E/A >0.8, raised E/e′ alone, a raised peak TR velocity alone and any two abnormal variables require step 3.
  3. Step 3 assesses the pulmonary vein S/D ratio (≤0.67), LA reservoir strain (≤18%) and the LA volume index (>34 mL/m²). Figure 3 lists IVRT ≤70 ms as an alternative variable; in a patient with heart disease, an IVRT this short suggests a raised LA pressure. One or more abnormal variables indicate a raised LA pressure. If none is abnormal, the LA pressure is normal, and the algorithm assigns no grade.
  4. In step 4, E/A grades a raised LA pressure: E/A <2 indicates grade 2 and E/A ≥2 indicates grade 3 diastolic dysfunction.

In the diagram above, a change in one measurement moves the slider to a band of the new result. A move of the slider returns every value to the model.

In a validation study of 951 patients with catheter-measured pressures, 2 patients remained unclassified by the algorithm (38 by the 2016 approach), and the accuracy of the algorithm was 86%.

Exclusions and limitations

The algorithm should not be applied in atrial fibrillation, mitral stenosis, severe primary mitral regurgitation or moderate or severe mitral annular calcification, after mitral valve repair or replacement or heart transplantation, or in patients with an LV assist device, pericardial constriction or pulmonary hypertension of non-cardiac cause. The guideline does not apply to children, to normal pregnancy or to patients during surgery.

If the grade is uncertain, the report should state whether the LA pressure is normal or raised. The e′ velocity decreases with age, and age-adjusted limits can be used in place of the fixed cut-off values.

In advanced cardiac amyloidosis, the mitral annular s′, e′ and a′ velocities can all be below 5 cm/s, a finding termed the “5-5-5” sign (chapter 18).

Key points

  1. Step 1 of the algorithm assesses e′, E/e′ and the peak TR velocity.
  2. If step 1 is not conclusive, step 3 assesses the pulmonary vein S/D ratio, LA reservoir strain and the LA volume index.
  3. When the LA pressure is raised, E/A determines the grade of diastolic dysfunction.

Cardiac masses and thrombus

Left atrial myxoma, LV thrombus and papillary fibroelastoma

A cardiac mass is described by its location, attachment, size, shape and mobility. The place of the mass, the wall motion beside it and an enhancing agent help to tell a thrombus from a tumor and from a normal structure.

Mass
Enhancing agent

Describing a mass

The report of a cardiac mass should give its location, attachment, size, echogenicity, shape and mobility, and a differential diagnosis such as a tumor, a vegetation or a thrombus. A pedunculated mass is attached by a thin stalk that lets it move; a sessile mass is attached by a broad base that prevents significant movement. In adults the two most common primary tumors, the myxoma and the papillary fibroelastoma, often present with stroke or another embolism.

Normal structures that mimic a mass

Normal structures can be taken for a mass on transthoracic echocardiography, and the report should name a normal variant as such:

  • Right atrium. A prominent Eustachian valve and a Chiari network.
  • Atrial septum. Lipomatous hypertrophy: thickening that spares the fossa ovalis and gives the septum a dumbbell shape. A myxoma, in contrast, is usually attached at the fossa ovalis.
  • Valves. Strands, or Lambl's excrescences: filiform structures no wider than 2 mm at the line of closure, on the atrial side of the mitral valve and the ventricular side of the aortic valve.

Left atrial myxoma

A myxoma lies in the LA in more than 75% of cases, attached by a stalk to the fossa ovalis in more than 90%. Myxomas are gelatinous and pedunculated. A large myxoma can obstruct the mitral orifice and cause mitral stenosis; a mobile, villous or friable one has a high risk of embolism. Up to one third of patients have evidence of embolism, and surgery is generally indicated once the diagnosis is made.

In the figure, a tumor longer than the distance from its stalk to the mitral annulus reaches into the LV in diastole and returns to the LA in systole. The mean gradient is the mean of 4V² over diastole on the CW inflow trace, with the stroke volume held, at a heart rate of 70/min; chapter 16 gives the bands of the mean gradient in rheumatic mitral stenosis.

LV thrombus

An LV thrombus forms where the wall motion is abnormal: after an acute myocardial infarction, and in a dilated LV with poor function. After an anterior infarction it is more common than after an infarction elsewhere (11.5% against 2.3%), and more common again with an ejection fraction below 40% (17.8%); most thrombi (90%) form within 14 days of the infarction. Chapter 11 shows the segments of each coronary territory.

A thrombus is a discrete mass with well-defined margins, distinct from the endocardium, seen in systole and diastole in an area of abnormal wall motion. It should be seen in two orthogonal views, an apical and a short-axis view. There are three types:

  • Mural. Flat and parallel to the endocardium, with one surface facing the blood.
  • Protruding. Standing into the cavity, with more than one surface facing the blood.
  • Mobile. Moving on its own, in part or as a whole.

Embolism is least common with a mural thrombus and most common with a mobile one; yet 40% of embolic events occur in patients whose thrombi are neither protruding nor mobile. In the figure a thrombus is called protruding when its thickness is more than 0.35 of the half-length of its base.

Near-field clutter, false tendons, trabeculations and a foreshortened apex can mimic a thrombus; clutter does not move with the wall and appears to pass through it. A focal zone at the apex, a higher frequency and color Doppler at a low aliasing velocity help; when doubt remains, an enhancing agent should be used. TTE is better than TEE for an apical thrombus, far from the transesophageal probe.

Papillary fibroelastoma

About 80% of papillary fibroelastomas lie on the valves, most often the aortic valve and then the mitral valve. On a valve the tumor lies typically on the downstream side: the aortic side of the aortic valve and the ventricular side of the mitral valve, the opposite of the usual site of an endocarditis lesion. It rarely causes significant valve dysfunction.

The tumor is homogeneous and often mobile, with a dense central stalk and frond-like extensions, like a sea anemone. Most are smaller than 20 mm (mean 8–9 mm). TTE detects about 62% of them and TEE about 77%. In published cases, the mobility of the tumor was the only independent predictor of death or nonfatal embolism. The ASE notes that patients with symptoms, or with a large or very mobile tumor, should undergo surgery, and that a small sessile tumor in a patient without symptoms may be watched.

Enhancing agents, TEE and CMR

An ultrasound enhancing agent fills the cavities, and a thrombus then shows as a filling defect; the ASE recommends an agent when an LV thrombus cannot be ruled in or out without one. The uptake of the agent in a mass shows its blood supply: a thrombus and a papillary fibroelastoma are generally avascular and do not enhance, and a myxoma has a poor blood supply and enhances in part. Complete enhancement, or enhancement greater than that of the myocardium, supports a highly vascular tumor, most often malignant. An avascular mass can appear to enhance in part in the far field, so the uptake is judged with the mass in the near field.

In patients at high risk, against delayed-enhancement CMR, echocardiography detected 33% of LV thrombi without contrast and 61% with contrast; the thrombi that contrast echocardiography missed were more likely mural, or small at the apex. CMR has the highest sensitivity and specificity for an LV thrombus, and it should be considered when contrast echocardiography finds none but the suspicion persists. TEE may be better than TTE for a cardiac tumor, especially a myxoma or a papillary fibroelastoma.

Key points

  1. A left atrial myxoma is usually attached by a stalk to the fossa ovalis. A large one prolapses into the LV in diastole and can obstruct the mitral valve.
  2. An LV thrombus lies in a segment with abnormal wall motion, most often the apex after an anterior infarction. It should be seen in two views; with an enhancing agent it shows as a filling defect.
  3. A papillary fibroelastoma is a small mass on the downstream side of a valve, most often the aortic side of the aortic valve. Its mobility predicts embolism.

Automated measurements

EchoNet-Measurements: calipers and peaks from heat maps

A report holds dozens of measurements, each a caliper or a peak that a sonographer places by hand. EchoNet-Measurements places them with one deep learning model for each measurement, and converts the points to centimeters and velocities with the calibration stored in the image.

Image
Two-peaked map
No DICOM data

Measurement by deep learning

Manual measurement takes time, and it varies from one sonographer to the next. The first video model of LV function, EchoNet-Dynamic, segmented the LV in apical four-chamber videos with a Dice coefficient of 0.92 and estimated the LVEF over several beats, with a mean absolute error of 4.1% in internal and 6.0% in external validation. EchoNet-LVH measured the parasternal long axis: the septum with a mean absolute error of 1.2 mm, the LV diameter with 2.4 mm and the posterior wall with 1.4 mm.

Deep learning can also guide the acquisition itself. Eight nurses with no experience in ultrasonography, guided by a deep learning algorithm, each scanned 30 patients; their studies were of diagnostic quality for LV size, LV function and pericardial effusion in 237 of 240 patients (98.8%), and for RV size in 222 (92.5%).

How EchoNet-Measurements measures

EchoNet-Measurements was trained on 877,983 measurements that sonographers and cardiologists made in routine practice, in 155,215 studies of 78,037 patients at Cedars-Sinai Medical Center. It has a separate segmentation model (DeepLabv3) for each of 18 measurements:

  • Nine B-mode measurements. The septum, the LV internal diameter and the posterior wall; the LA diameter; the RV basal diameter; the aortic root and the ascending aorta; the pulmonary artery; and the IVC.
  • Nine Doppler and M-mode measurements. The peak velocities of TR, the aortic valve, MR and the LVOT; septal and lateral e′; the mitral E velocity and E/A; and TAPSE.

A model does not draw a line. It outputs a heat map for each point it looks for: two for a caliper, its two ends, and one for a Doppler peak. In the public code, each point is the weighted center of its heat map. The distance between the two ends, in pixels, times the pixel size that the DICOM file stores gives centimeters. For a Doppler peak, the distance from the baseline, times the velocity per pixel that the file stores, gives the velocity. A B-mode model measures every frame of the video, and the frames with the largest and the smallest LV diameter mark end-diastole and end-systole.

What the figure shows

The heat maps in the figure are drawn on the site's own caliper points; EchoNet-Measurements did not process these images. The Two-peaked map switch splits one heat map into two peaks, for example at the septum and at an RV trabeculation. The weighted center then falls between the peaks, on neither structure, and the wall measures wrong. The No DICOM data switch removes the calibration, as an export to a common video format does: the points remain, but the model cannot give a number.

Performance

Agreement with sonographers was given as a coverage probability: the share of paired measurements that differ by less than an acceptable difference, set for each measurement from published intraobserver variability. Across the 18 measurements, the mean coverage probability was 0.796 in held-out studies at Cedars-Sinai and 0.839 in external studies at Stanford Healthcare, and the mean relative difference was 0.120 and 0.096. Run end to end on 2,103 later studies at Cedars-Sinai, the model had a mean coverage probability of 0.803 and a mean relative difference of 0.108. Performance was consistent across age, sex, atrial fibrillation, obesity and machine vendor. The models also measured images of another vendor, video recorded from a scanner's screen, stress studies and teaching videos.

Agreement was higher for the Doppler measurements than for the linear ones. The authors attribute this to the greater freedom of a linear measurement: there are more frames to choose from, and the caliper's place is more subjective. Two cardiologists reviewed 180 images on which the AI and the sonographer differed most (the top 10% of differences). They preferred the sonographer's measurement in 50.6%, preferred the AI's in 11.1%, and found both acceptable in 30.0%; in 8.3% the image was too noisy or blurred to measure.

Limits

  • The models were trained at one center, and they learn from its sonographers' measurements: their conventions and their errors.
  • A model measures a single image. On a poor image, a sonographer can use the clinical context and the frames around it; the model cannot.
  • Image quality changes accuracy. An image-quality model removed low-quality videos and Doppler images before the end-to-end measurement.
  • The 18 measurements are not all of a comprehensive study: the velocity time integral, the PISA radius and the LA volume are not yet measured.
  • Each model measures one thing in the view it expects. The right view, the right beat and the calibration stored in the file all come before the measurement.

Key points

  1. EchoNet-Measurements has one segmentation model for each of 18 measurements: 9 in B-mode and 9 in Doppler and M-mode.
  2. A model outputs a heat map for each point. The point is the weighted center of its map, and the calibration stored in the DICOM file converts the points to centimeters or velocities.
  3. A heat map with two peaks puts the point between them, on neither structure.
  4. The agreement with sonographers held in external validation and when the model ran on whole studies.

AI interpretation and measurement

EchoPrime and EchoNet-Measurements: views, weights, task heads and calipers

A comprehensive study holds many videos from many views, and dozens of measurements. EchoPrime reads every video and drafts each section of the report; EchoNet-Measurements places each caliper and peak, and converts it with the calibration stored in the image.

Models that read echocardiograms

The first deep learning models for echocardiography each did one task, alone or in a pipeline; later models learned many tasks at once from whole videos. A vision–language model also learns from the cardiologist's report: EchoCLIP, trained on videos and the text of their reports, reads one image at a time and up to 77 tokens of text. EchoPrime reads every video of a study and up to 512 tokens of its report.

How EchoPrime reads a study

EchoPrime has four parts:

  • View classifier. It sorts B-mode and color Doppler videos into 58 standard views, which the public code groups into 11 view groups.
  • Video encoder. A video transformer (mViT) turns each video, 16 frames of 224 × 224 pixels, into an embedding of 512 numbers.
  • Text encoder. A language model (PubMedBERT), trained with the video encoder, turns a report into an embedding close to those of its study's videos.
  • Anatomical attention. For each of the 15 report sections, each view group has a weight, learned by multiple instance learning; the public code holds the 165 weights. A section's study embedding is the normalized sum of the video embeddings, each multiplied by its view group's weight.

With a single apical four-chamber video, EchoPrime performed across all tasks about as well as with full studies: the weights show how it mixes the videos it has, not which videos a finding needs.

Retrieval and task heads

The published model drafts each section by retrieval from the earlier studies whose embeddings lie closest to the study's own. A number, such as the LVEF, is the mean of the 50 closest; a finding enters the report when more than half of them carry it. A rare finding is therefore found only when similar studies are in the library. Recent versions, in development and not yet published, replace retrieval with about 150 task heads, one for each task of the report. Their number heads anchor the measurements and adjust them.

How EchoNet-Measurements measures

Earlier, EchoNet-Dynamic estimated the LVEF over several beats, and EchoNet-LVH measured LV wall thickness and diameter. EchoNet-Measurements, trained on measurements made in routine practice, has a separate segmentation model for each of 18 measurements, nine in B-mode and nine in Doppler and M-mode. Each model measures one thing in the view it expects.

A model outputs a heat map for each point it looks for: two for a caliper, its two ends, and one for a Doppler peak. In the public code, each point is the weighted center of its heat map. The calibration that the DICOM file stores converts pixels to centimeters or velocities. An export to a common video format drops the calibration: the points remain, but the model cannot give a number.

What the figure shows

The figure follows one study of the heart shown through both models to one report, in seven steps. A click on the strip of sections, a tile or a sentence chooses a section.

The task heads and the anchor are a simulation. Each head's value is the site's own measurement of the heart shown, and its range is that value ± 10%: a band chosen for the figure, not an error of the model. Outside the range, the caliper's end moves to the heat map's peak that agrees with the head; with no such peak, the value is flagged for review. The images and the words of the report are the site's own, and the heat maps are drawn on the site's own caliper points. Neither model processed these images.

Performance

Across 17 classification and 11 regression tasks, the mean AUC of EchoPrime was 0.92 at Cedars-Sinai and 0.85 to 0.89 at the external sites. The mean absolute error of the LVEF was 4.79 percentage points in the internal test set and 4.14 to 6.46 at the external sites, against 6.23 to 10.37 for EchoCLIP.

EchoNet-Measurements was compared with sonographers by the coverage probability: the share of paired measurements that differ by less than an acceptable difference. Across the 18 measurements, the mean coverage probability was 0.796 in held-out studies at Cedars-Sinai and 0.839 in external studies at Stanford Healthcare.

Limits

  • Each model was trained on the studies of one center, and all the data of EchoPrime were collected retrospectively. EchoNet-Measurements learns the conventions and the errors of its center's sonographers.
  • Spectral Doppler and M-mode recordings are still images, so EchoPrime was not trained on them; the authors point to models that measure them directly.
  • On a poor image, a sonographer can use the clinical context and the frames around it; a measurement model, which reads a single image, cannot. The 18 measurements do not yet include the velocity time integral, the PISA radius or the LA volume.

Prospective trials

In the first blinded randomized trial of AI in echocardiography, a cardiologist, blind to the source, finalized an initial LVEF from AI or from a sonographer. The cardiologist changed the LVEF by more than 5% in 16.8% of the AI group and 27.2% of the sonographer group; AI was non-inferior and superior.

The AI ECHO INSIGHT trial tests whole reports: a blinded cardiologist finalizes a preliminary report drafted by AI, by a cardiologist or by a sonographer, and the primary outcome is the rate of substantial change. The results are not yet published.

Key points

  1. EchoPrime sorts each video by view, turns it into 512 numbers and weights it by view group for each of the 15 report sections.
  2. The published model drafts each section from the 50 closest earlier studies; the weights show how it mixes views, not which views a finding needs.
  3. EchoNet-Measurements has one model for each of 18 measurements. Each point is the weighted center of a heat map, and the calibration stored in the DICOM file converts pixels to centimeters or velocities.
  4. In a blinded randomized trial, cardiologists changed an AI-first LVEF less often than a sonographer-first LVEF.

Bonus chapters

Left ventricular assist devices

The HeartMate 3: the surveillance study, the speed ramp and complications

A continuous-flow LVAD takes blood from the LV apex through an inflow cannula and returns it to the ascending aorta through an outflow graft. Echocardiography shows how far the pump unloads the LV at each speed, and it detects the complications of the device.

Case

The device

Echocardiography shows the inflow cannula and parts of the outflow graft, but not the impeller. The HeartMate 3 (HM3), now the only LVAD implanted, typically runs at 4,800 to 5,600 rpm.

Every 2 seconds the HM3 lowers its speed by 2,000 rpm for 0.15 s and then raises it by 4,000 rpm for 0.20 s. This artificial pulse makes a Doppler peak out of step with the heartbeat, not to be mistaken for intermittent obstruction or for opening of the aortic valve. The inflow usually peaks below 1.0 m/s, up to 1.2 m/s with the pulse; the outflow graft peaks below 2 m/s on CW Doppler, but the pulse can take it above 2 m/s.

The surveillance study

A surveillance study should be considered about 2 weeks after implantation or before discharge, whichever comes first, then at 1, 3, 6 and 12 months, and every 6 to 12 months after that.

  • LV size. The LV internal diameter at end-diastole (LVIDd) in the parasternal long axis is the most reproducible measure of the LV. By 3 months it can be expected to fall by at least 15% from its value before implantation.
  • Aortic valve. M-mode shows whether the valve opens. A valve that stays closed is linked to thrombus in the aortic root and to de novo AR.
  • Septum. At end-diastole, a leftward shift of the septum comes from a high RV end-diastolic pressure, a low LV preload or too high a speed; a rightward shift, from a high LV end-diastolic pressure: too low a speed, pump dysfunction, severe AR or a high afterload.
  • Inflow cannula. A well-placed cannula lies at or near the LV apex and points at the mitral valve, with laminar flow into it.
  • Cardiac output. When the aortic valve stays closed and there is no significant AR or PR, the total cardiac output from the RVOT VTI (chapter 08) equals the LVAD's output.

The speed ramp

A ramp study records the echocardiogram at each step of speed: in the HM3 studies, from 4,600 rpm in steps of 100 rpm to 6,200 rpm. Because a lower speed can open the aortic valve over a root thrombus and cause an embolism, the study starts after a check of the anticoagulation and of the baseline images for thrombus.

As the speed of a working pump rises, the LV gets smaller, the aortic valve opens less often or for less time and the RVOT stroke volume rises. With the HM3, the LVEDD fell by 0.15 cm for each 100 rpm, and the RV volumes rose only at the higher speeds.

Below the minimum speed, the LVIDd rises from baseline, the septum may shift rightward, the MR may grow and the aortic valve may open more often or for longer. Above the maximum speed, the septum shifts leftward or impedes the flow into the cannula, and the TR may worsen. The optimal HM3 speed is 100 rpm below the maximum speed of optimal LV unloading, and the opening of the aortic valve is a secondary goal to the relief of heart failure.

A suction event, a partial occlusion of the inflow cannula by a segment of LV myocardium, usually comes from over-pumping, and a lower speed often corrects it; a low preload or a low afterload, as in hypovolemia or sepsis, can also cause it. Its signs are an LV smaller than about 3 cm, a leftward shift of the septum and worse TR, with or without ventricular ectopy and intermittent obstruction of the inflow. An inflow velocity above 1.5 m/s on CW Doppler points to an obstruction of the inflow, from suction or a malpositioned cannula.

RV failure

RV failure on LVAD support shows as a larger RV with lower systolic function, a dilated IVC, more TR, a lower RVOT stroke volume, and lower velocities in the cannula and the graft, below 0.5 m/s in severe failure. A septum bowed far to the left, with a small LV and a dilated, failing RV, means that the pump lacks preload, and the speed should be lowered. The RV basal diameter is graded as in chapter 13: normal below 4.1 cm, and severely dilated above 4.9 cm.

Aortic regurgitation

De novo AR occurs in about 25% to 33% of patients by 12 months and affects the pump's performance, morbidity and mortality. The pump sends the regurgitant blood back to the aorta, a blind loop: the flow in the device is high, but the forward output, the RVOT cardiac output, falls and the LV grows. Higher speeds tend to increase the AR.

A vena contracta of 0.3 cm or more, or a jet width of more than 46% of the LVOT at a Nyquist limit of 50 to 60 cm/s, indicates at least moderate AR. The pressure half-time and the diastolic flow reversal in the aorta are not reliable on LVAD support, because the AR runs into systole, and with the valve shut it is continuous (chapter 16).

Obstruction

A thrombus in the pump or an obstruction of the cannula or the graft reduces the pump's flow. Against the patient's baseline, the LV dilates again, the septum shifts rightward, the aortic valve opens more and the diastolic velocities in the cannula and the graft fall. When the speed is raised, the LVIDd, the opening of the aortic valve and the RVOT stroke volume do not change as expected. Near an obstruction of the outflow graft the peak velocity is 2 m/s or more; the figure samples the graft at the narrowing.

Key points

  1. With a working HM3, the LV gets smaller by 0.15 cm per 100 rpm. An LV below 3 cm with a leftward septum is a suction event.
  2. The Doppler peak of the HM3's artificial pulse, every 2 seconds, is neither an obstruction nor an opening of the aortic valve.
  3. In de novo AR the pump flow is high while the RVOT output falls; a vena contracta of 0.3 cm or more indicates at least moderate AR.
  4. An LV, an aortic valve and an RVOT output that do not change with the speed point to an obstruction.

Aortic stenosis

LV pressure load

In calcific aortic stenosis, the valve orifice narrows, the transvalvular jet velocity increases and the LV wall thickens in response to the pressure load. In the late stage, LV systolic dysfunction reduces the stroke volume, and the transvalvular gradient decreases with it.

Natural history

  1. In progressive stenosis, mild stenosis has a peak velocity of 2.0–2.9 m/s or a mean gradient below 20 mmHg, and moderate stenosis has a peak velocity of 3.0–3.9 m/s or a mean gradient of 20–39 mmHg. Early LV diastolic dysfunction can be present, and the LVEF is normal.
  2. Severe stenosis is defined by a peak velocity ≥4 m/s or a mean gradient ≥40 mmHg, and the valve area is typically ≤1.0 cm². The LV has diastolic dysfunction and mild hypertrophy, with a normal LVEF. Very severe stenosis is defined by a peak velocity ≥5 m/s or a mean gradient ≥60 mmHg.
  3. LV dysfunction in severe stenosis is defined by an LVEF below 50%.
  4. In low-flow, low-gradient stenosis, LV systolic dysfunction reduces the transvalvular flow; the area is ≤1.0 cm², with a peak velocity below 4 m/s or a mean gradient below 40 mmHg.

The ACC/AHA stages also require the symptom status: patients in stage C have no symptoms, and patients in stage D have symptoms. The figure and the diagram model the echocardiographic findings only, and the diagram names the echocardiographic pattern, not the stage.

Grading

AVA = LVOT area × VTI(LVOT) ÷ VTI(AV)  ·  ΔP = 4v²  ·  mean gradient = mean of 4v² over ejection

Chapter 08 Doppler hemodynamics describes the stroke volume from the LVOT and the simplified Bernoulli equation. The stroke volume that crosses the LVOT also crosses the valve. The valve area therefore equals the LVOT area × the LVOT VTI ÷ the AV VTI, the continuity equation. The diagram grades each criterion by Table 3 of the EACVI/ASE recommendations. Table 3 grades a peak velocity of 2.5 m/s or less as aortic sclerosis without stenosis. The ACC/AHA progressive stage starts at 2.0 m/s.

  • The highest jet velocity should be recorded with continuous-wave (CW) Doppler from several acoustic windows, and the window that gives it should be reported; angle correction should not be used (chapter 03).
  • The peak gradient is 4 × (peak velocity)². The mean gradient is the average of the instantaneous gradients over ejection, from the traced CW envelope.
  • A peak velocity ≥4.0 m/s, a mean gradient ≥40 mmHg or an area <1.0 cm² each suggests severe stenosis; ideally, all three criteria are concordant. A velocity ratio below 0.25 also indicates severe stenosis.
  • The dimensionless index is the ratio of the LVOT VTI to the AV VTI. The velocity ratio is the ratio of the LVOT peak velocity to the AV peak velocity. Neither uses the LVOT diameter. The diagram grades both by the velocity-ratio cut-offs of Table 3.
  • As the obstruction becomes more severe, the velocity peaks later in systole and the Doppler envelope becomes more rounded; in mild stenosis, the velocity peaks early and the envelope is triangular.

In the diagram above, a change in one measurement moves the slider to a band of the new result. A move of the slider returns every value to the model. The slider has no band for paradoxical low-flow, low-gradient stenosis: in the model, the LVEF falls before the gradient does.

Low-flow, low-gradient aortic stenosis

A high gradient is a peak velocity ≥4 m/s or a mean gradient ≥40 mmHg. It indicates severe stenosis whether the flow and the LV function are normal or reduced. With an area <1.0 cm² and a low gradient, the flow and the LVEF name the pattern. Low flow is defined as a stroke volume index below 35 mL/m².

  • Classical low-flow, low-gradient stenosis has an LVEF <50%. During low-dose dobutamine echocardiography, a velocity ≥4.0 m/s with an area that remains ≤1.0 cm² confirms severe stenosis, whereas an increase in area to above 1.0 cm² suggests pseudo-severe stenosis. Stage D2 also requires symptoms and severe stenosis confirmed by dobutamine echocardiography.
  • In paradoxical low-flow, low-gradient stenosis, the LVEF is ≥50%. A small LV with a low stroke volume produces a low gradient across a severe stenosis. Stage D3 also requires symptoms.
  • Normal-flow, low-gradient stenosis has an LVEF ≥50% and a stroke volume index ≥35 mL/m². It often reflects an error of measurement, most often an LVOT diameter that is measured too small. At normal flow, a mean gradient of 40 mmHg corresponds to an area nearer 0.8 than 1.0 cm².

Key points

  1. The thresholds for severe aortic stenosis are a peak velocity of 4 m/s, a mean gradient of 40 mmHg and a valve area of 1.0 cm²; ideally, all three criteria are concordant.
  2. The continuity equation squares an error in the LVOT diameter. The dimensionless index and the velocity ratio do not use the diameter.
  3. LV wall thickening develops first, and the LVEF falls only late in the course of the disease.
  4. A low gradient with an area below 1.0 cm² needs an assessment of the flow and the LVEF.

Aortic regurgitation

LV volume and pressure load

In aortic regurgitation, blood flows back from the aorta through the incompetent aortic valve into the LV during diastole. The LV receives blood from both the LA and the aorta, dilates and ejects a large stroke volume. In the late stage, LV systolic dysfunction develops.

Grading and staging

The pressure half-time is the time in which the diastolic pressure difference between the aorta and the LV falls by half; a more severe leak equalizes the two pressures faster and shortens it (chapter 14 measures it at the mitral valve).

  1. Mild aortic regurgitation is characterized by a small central jet, a faint or incomplete CW Doppler signal, a pressure half-time above 500 ms and brief early diastolic flow reversal in the descending aorta.
  2. In moderate aortic regurgitation, the LV is normal in size or dilated, the pressure half-time is 500–200 ms and the regurgitant volume is 30–59 mL.
  3. Severe aortic regurgitation is indicated by a vena contracta >0.6 cm, a jet width ≥65% of the LVOT diameter, a regurgitant volume ≥60 mL, a regurgitant fraction ≥50%, an EROA ≥0.30 cm², a pressure half-time below 200 ms and holodiastolic flow reversal in the descending aorta. Holodiastolic flow reversal in the abdominal aorta is consistent with severe AR. The EACVI uses an end-diastolic velocity ≥20 cm/s in the proximal descending aorta as a criterion of severe AR. The diagnosis of chronic severe AR also requires LV dilation.
  4. In asymptomatic severe AR, ACC/AHA stage C1 has an LVEF >55% and an LV end-systolic diameter ≤50 mm; stage C2, with LV dysfunction, has an LVEF ≤55%, or an end-systolic diameter >50 mm or >25 mm/m².

Integrated grading

The ASE algorithm first counts the specific criteria. Four or more specific criteria for mild AR define mild regurgitation, and four or more for severe AR define severe regurgitation. Otherwise, the regurgitant volume, the regurgitant fraction and the EROA assign a grade from I to IV. Grade I is mild, grades II and III are moderate, and grade IV is severe. Grade III with three specific criteria for severe AR also indicates severe regurgitation. If the findings are inconsistent, the grade is indeterminate, and TEE or CMR can quantify the regurgitation. The algorithm gives no rule for discordant quantitative measures; the diagram uses the middle grade of the three.

LVOT velocity in aortic regurgitation

The LV ejects the forward stroke volume plus the volume that returns to the LV in diastole. The regurgitant volume is the stroke volume through the regurgitant valve minus the stroke volume through a competent valve, each calculated as in chapter 08. In the figure, the LVOT VTI increases as the regurgitation becomes more severe. The diagram compares the LVOT with the mitral stroke volume, which is valid without significant MR, and divides the regurgitant volume by the VTI of the AR jet to give the EROA.

Pitfalls

  • The pressure half-time shortens as the LV diastolic pressure rises, and it can lengthen with chronic adaptation to severe AR.
  • The length of the color Doppler jet in the LV is not a reliable measure of severity.

Key points

  1. Four or more specific criteria for mild or for severe AR define the grade; otherwise, the regurgitant volume, the regurgitant fraction and the EROA decide.
  2. Severe aortic regurgitation is indicated by a vena contracta >0.6 cm, a jet width ≥65% of the LVOT diameter and a regurgitant volume ≥60 mL.
  3. Holodiastolic flow reversal in the abdominal aorta indicates severe aortic regurgitation.
  4. In asymptomatic severe AR, an LVEF ≤55% or an LV end-systolic diameter >50 mm defines ACC/AHA stage C2.

Mitral stenosis

LV inflow obstruction

In rheumatic mitral stenosis, the commissures fuse and the leaflets dome in diastole. As the mitral orifice narrows, LA pressure increases, the LA enlarges and pulmonary artery pressure rises, with secondary involvement of the right heart.

Echocardiographic findings by stage

  1. In progressive stenosis, the commissures are fused and the leaflets dome in diastole; the valve area is >1.5 cm², the pressure half-time is <150 ms, LA enlargement is mild to moderate and pulmonary artery pressure is normal at rest.
  2. In severe stenosis, the valve area is ≤1.5 cm² and the pressure half-time is ≥150 ms; LA enlargement is severe, and the PA systolic pressure is above 50 mmHg.

The ASE divides progressive stenosis into mild stenosis (valve area >2.5 cm², pressure half-time <100 ms, mean gradient <5 mmHg, PA systolic pressure <30 mmHg) and moderate stenosis (valve area 2.5–1.6 cm², pressure half-time 100–149 ms, mean gradient 5–9 mmHg, PA systolic pressure 30–49 mmHg).

Grading

The ASE grades mitral stenosis with several measures: the valve area, the pressure half-time, the mean gradient and the PA systolic pressure. Agreement among them makes the grade more reliable, and when they disagree, stress echocardiography can assess the hemodynamic severity. Planimetry is the preferred method for the valve area, so the diagram grades by the planimetered area and shows whether each other measure lies in the same band.

The PA systolic pressure is estimated as the TR gradient plus the RA pressure (chapter 08); the figure sets the RA pressure at 3 mmHg, and at 8 mmHg in severe stenosis, and in a patient the IVC gives it (chapter 07).

Measurement of valve area and gradient

MVA = 220 ÷ pressure half-time

  • Planimetry of the mitral orifice is performed in the parasternal short-axis view, which also displays the commissural fusion. When the methods give discordant areas, planimetry is the reference method.
  • The pressure half-time is the time required for the peak transmitral pressure gradient to fall by half; at that time, the velocity has fallen to about 70% of its peak. The constant 220 is empirical; Hatle described the method in 1979. By this equation, a pressure half-time of 100 ms corresponds to an area of 2.2 cm² and 150 ms to 1.47 cm², so near these values the area and the half-time can lie in different bands. The pressure half-time is not reliable immediately after balloon valvotomy or in the presence of severe aortic regurgitation or abnormal LV compliance.
  • The mean gradient, the average of the instantaneous gradients (chapter 12), varies with heart rate and transmitral flow, so it is not a criterion of severity; it should be reported together with the heart rate. In the figure, the stroke volume falls as the heart rate rises, and the cardiac output stays at about 4.9 L/min. At 110 beats per minute, the diastolic filling period is shorter, and the mean gradient across a severe stenosis about doubles. At 70 beats per minute, an area of 1.5 cm² gives a mean gradient of 6.6 mmHg, in the moderate band.

Key points

  1. Mitral stenosis is severe when the valve area is ≤1.5 cm² and the pressure half-time is ≥150 ms.
  2. Planimetry is the preferred method for the valve area; the pressure half-time, the mean gradient and the PA systolic pressure support the grade.
  3. The hemodynamic consequences of mitral stenosis are LA enlargement and a rise in pulmonary artery pressure.
  4. The mean gradient should be reported together with the heart rate at which it is measured.

Mitral regurgitation

Left heart volume overload

In mitral regurgitation, part of the LV stroke volume flows back into the LA through the incompetent mitral valve during systole. The LV and LA dilate to accommodate the additional volume, and LV systolic dysfunction develops late in the course.

Color Doppler

Echocardiographic findings by grade and stage

  1. A small central jet, normal leaflets, a vena contracta below 0.3 cm, absent flow convergence and A-wave-dominant mitral inflow indicate mild regurgitation.
  2. In moderate regurgitation, the LV and LA are normal in size or mildly dilated, and pulmonary vein flow is normal or shows systolic blunting.
  3. In severe regurgitation, the EROA is ≥0.40 cm², the regurgitant volume ≥60 mL, the regurgitant fraction ≥50% and the vena contracta ≥0.7 cm. The LV and LA are dilated, the CW Doppler signal is dense and triangular, systolic flow in the pulmonary veins is absent or reversed, and the mitral E velocity exceeds 1.2 m/s.
  4. In the ACC/AHA classification, stage C1 is defined by an LVEF >60% and an LV end-systolic diameter <40 mm, and stage C2, with LV dysfunction, by an LVEF ≤60% or an LV end-systolic diameter ≥40 mm.

Integrated grading

The ASE algorithm first counts the specific criteria. Four or more specific criteria for mild MR define mild regurgitation, and four or more for severe MR define severe regurgitation. Otherwise, the EROA, the regurgitant volume and the regurgitant fraction assign a grade from I to IV. Grade I is mild, grades II and III are moderate, and grade IV is severe. Grade III with three specific criteria for severe MR, or with an elliptical orifice, also indicates severe regurgitation. If the findings are inconsistent, the grade is indeterminate, and TEE or CMR can quantify the regurgitation. The algorithm gives no rule for discordant quantitative measures; the diagram uses the middle grade of the three.

PISA method

flow = 2π r² × Va  ·  EROA = flow ÷ peak velocity  ·  RVol = EROA × VTI

Blood accelerates as it converges on the regurgitant orifice; at the aliasing velocity (Va), the color changes, and the isovelocity surface at Va is a hemisphere of radius r. The color baseline should be shifted toward the jet to lower Va to about 30 to 40 cm/s, and the radius should be measured at the time of the peak jet velocity. At this setting, a radius of 1.0 cm or more is specific for severe MR. The method applies the principle of chapter 08: the flow rate through a surface equals its area × the velocity.

The figure applies the method in four steps:

  1. The color scale is set so that the flow aliases at 32 cm/s. In a study, the view is zoomed on the mitral valve, and the color baseline is shifted toward the jet.
  2. The radius r runs from the orifice to the first aliasing boundary. The flow rate is 2πr² × 32 cm/s.
  3. The flow rate divided by the peak MR velocity of 5.0 m/s gives the EROA.
  4. The EROA multiplied by the VTI of the jet gives the regurgitant volume. A jet through all of systole has a VTI of 150 cm.

For example, an EROA of 0.40 cm² at a peak velocity of 5.0 m/s corresponds to a flow rate of 200 mL/s. At 32 cm/s, this flow rate gives a radius of 1.00 cm, and the regurgitant volume is 60 mL. All three values reach the thresholds for severe MR. At the same velocity, an EROA of 0.10 cm² gives a radius of 0.50 cm, larger than the 0.3 cm of a small flow convergence in mild MR.

  • The radius is squared in the flow equation; errors of 10 to 25% are common, even among experts.
  • An elliptical orifice, which is common in secondary MR, causes PISA to underestimate the flow. In secondary MR, an EROA ≥0.30 cm² by 2D PISA may still indicate severe regurgitation; the EACVI accepts an EROA ≥0.30 cm² or a regurgitant volume ≥45 mL as severe.
  • When regurgitation occupies only part of systole, the regurgitant volume should be used, because a measurement from a single frame overestimates the EROA.

Pitfalls

  • A normal LA size generally excludes severe chronic MR, whereas a dilated LA alone does not establish it.
  • Color jet area is useful to exclude MR but is unreliable for grading its severity; for the assessment of regurgitant jets, the color scale should be set to 50 to 70 cm/s (chapter 03). The figure shows the flow convergence at an aliasing velocity of 32 cm/s. Its jet area is the value at a color scale of 50 to 70 cm/s.
  • Systolic flow reversal in the pulmonary veins is specific for severe regurgitation but is not sensitive.

Key points

  1. Four or more specific criteria for mild or for severe MR define the grade; otherwise, the EROA, the regurgitant volume and the regurgitant fraction decide.
  2. Mitral regurgitation is severe when the EROA is ≥0.40 cm², the regurgitant volume is ≥60 mL and the regurgitant fraction is ≥50%.
  3. A mitral E velocity >1.2 m/s and systolic flow reversal in the pulmonary veins support a severe grade.
  4. An LVEF ≤60% or an LV end-systolic diameter ≥40 mm indicates ACC/AHA stage C2.

Tricuspid regurgitation

Right heart volume overload

Tricuspid regurgitation imposes a volume overload on the right heart. The RV, the tricuspid annulus and the RA dilate, and the systemic veins distend. In torrential regurgitation, the jet velocity falls because the RV and RA pressures approach each other.

Color Doppler

Echocardiographic findings by grade

  1. In mild regurgitation, the jet is small, narrow and central, the CW Doppler signal is faint, hepatic vein flow is systolic-dominant and the IVC diameter is below 2 cm; the RA pressure estimate uses 2.1 cm (chapter 07).
  2. In moderate regurgitation, the RV and RA are normal in size or mildly dilated, hepatic vein flow shows systolic blunting, the vena contracta is 0.3–0.69 cm and the EROA is 0.20–0.39 cm².
  3. In severe regurgitation, the vena contracta is ≥0.7 cm, the EROA ≥0.40 cm², the regurgitant volume ≥45 mL, the PISA radius >0.9 cm (with the color baseline shifted to an aliasing velocity of 28 cm/s) and the jet area >10 cm²; hepatic vein flow shows systolic reversal, the tricuspid E velocity is >1.0 m/s and the IVC diameter is >2.5 cm. The ACC/AHA criteria add a dilated RV and RA and an elevated RA pressure with a c-V wave.
  4. Two grades beyond severe are defined: massive regurgitation, with a vena contracta of 1.4–2.0 cm, an EROA of 0.60–0.79 cm² and a regurgitant volume of 60–74 mL, and torrential regurgitation, with a vena contracta ≥2.1 cm, an EROA ≥0.80 cm² and a regurgitant volume ≥75 mL. An echocardiography report may describe massive and torrential TR as subgroups of severe TR.

Integrated grading

The ASE algorithm first asks whether most of the specific criteria for mild or for severe TR are present. The guideline text asks for a majority of the specific signs, so the diagram counts four of the seven. If neither set has a majority, the TR is probably moderate, and the vena contracta, the EROA and the regurgitant volume decide between mild, moderate and severe. Unlike MR and AR, TR has no validated quantitative grades I to IV, and clinical experience with its quantitation is limited. If the findings are inconsistent, the grade is indeterminate, and TEE or CMR can quantify the regurgitation. The algorithm gives no rule for discordant quantitative measures; the diagram uses the middle grade of the three. It uses the same rule for the EACVI grades beyond severe.

Pitfalls

  • The peak TR velocity does not indicate the regurgitant volume. Very severe TR often has a low peak velocity, about 2 m/s, because the RV and RA pressures equalize; the EACVI lists a peak velocity below 2 m/s for massive TR. A triangular jet signal then underestimates the RV systolic pressure (chapter 08).
  • Systolic flow reversal in the hepatic veins is specific for severe TR once other causes (atrial fibrillation, pacing, heart block, respiration, preload, altered RA or RV compliance) have been excluded.
  • The regurgitant volume threshold for severe TR (45 mL) is lower than that for severe MR (60 mL) at the same EROA, because the TR velocity is lower. The regurgitant volume is the EROA × the VTI of the TR jet, and a slow jet has a short VTI. At a peak velocity of 2.2 m/s, an EROA of 0.80 cm² gives about 40 mL; in the figure, the vena contracta and the EROA reach the grades for massive and torrential TR before the regurgitant volume does.
  • The figure shows the flow convergence at an aliasing velocity of 28 cm/s, and the jet as a share of the RA area at a scale of 50 to 70 cm/s, at which the jet criteria are defined. By the PISA method (chapter 15), the flow rate 2πr² × 28 cm/s equals the EROA × the peak TR velocity. Beyond severe TR the velocity falls as the regurgitation increases, so the PISA radius stays at 1.0–1.1 cm while the EROA rises from 0.60 to 1.21 cm².
  • At the time of left-sided valve surgery, tricuspid repair is reasonable when the tricuspid annulus measures more than 4.0 cm in diastole, even with less than severe TR.

Key points

  1. Four or more of the seven specific criteria for mild or for severe TR define the grade; otherwise, the vena contracta, the EROA and the regurgitant volume decide.
  2. Tricuspid regurgitation is severe when the vena contracta is ≥0.7 cm, the EROA is ≥0.40 cm² and the regurgitant volume is ≥45 mL.
  3. Systolic flow reversal in the hepatic veins is specific for severe tricuspid regurgitation.
  4. A low peak TR velocity does not exclude severe tricuspid regurgitation.

Prosthetic valves

Aortic prostheses: stenosis and mismatch

A prosthetic aortic valve is assessed by its Doppler velocities, its EOA and its DVI, against the reference values of its type and size. A high gradient can come from obstruction of the valve, from a normal valve that is small for the patient, or from a high flow.

Valve
Cause

Imaging the prosthesis

The figure shows a 23-mm stented bovine pericardial valve or a 23-mm bileaflet mechanical valve; the short axis shows the EOA as the area of the bioprosthesis's orifice. Reverberation and shadowing from an aortic prosthesis prevent a complete assessment of the posterior annulus and root on TTE, and can limit the anterior root on TEE; TEE is recommended when the posterior annulus or root is poorly seen on TTE, or may be abnormal.

An initial TTE after implantation is recommended; this baseline study shows whether mismatch is present, and later studies are compared with it. After a surgical bioprosthesis, TTE at 5 and 10 years and then annually is reasonable, even without a change in clinical status.

Gradients, EOA and DVI

The pressure gradient is 4V², or 4(V2² − V1²) when the LVOT velocity exceeds 1.5 m/s. The EOA by the continuity equation (chapter 14) depends less on flow than the gradient does, and it is compared with the normal values of the same valve type and size. The LVOT diameter is the largest diameter square to the LVOT, just below the valve plane, not the label size of the prosthesis.

The DVI, the LVOT VTI divided by the VTI of the jet, needs no LVOT diameter; after surgical aortic valve replacement, a DVI of 0.35 or less is associated with adverse outcomes.

In a bileaflet mechanical valve, CW Doppler records the faster jet of the narrow central orifice, and the pressure recovers past the valve (chapter 09): the gradient is overestimated and the EOA underestimated, most in small valves at high flow. The normal values of each valve include this effect.

Grading prosthetic aortic stenosis

As a prosthesis narrows, its jet peaks later, and the contour turns from triangular to rounded and symmetric. The acceleration time, from the onset of flow to the peak velocity, is normal below 80 ms and suggests significant stenosis above 100 ms, and its ratio to the ejection time (AT/ET) is normal below 0.32 and suggests significant stenosis above 0.37. LV function and heart rate also change the contour and the acceleration time.

Significant stenosis should meet at least one flow-dependent measure (the peak velocity or the mean gradient) and one flow-independent measure (the EOA or the DVI). Prosthetic valve obstruction is usually defined as a rise in the mean gradient of more than 50% from baseline, or of more than 10 mmHg across an aortic prosthesis, once other causes such as a high-output state are excluded. With poor LV function or a high blood pressure, the gradient can stay low despite significant stenosis.

The figure grades possible stenosis by any measure outside its normal column, and significant stenosis by this rule; it takes a DVI above 0.35 as normal, by the table, while the guideline's algorithm for a high velocity separates its branches at 0.30 and 0.25.

Obstruction, mismatch or high flow

In prosthesis–patient mismatch, the EOA of a normal prosthesis is too small for the patient's body size and flow needs: the indexed EOA (the EOA divided by the body surface area) is small, and 0.85 cm²/m² or less is the usual threshold in the aortic position. With a BMI below 30 kg/m², mismatch is moderate at 0.66–0.85 cm²/m² and severe at 0.65 cm²/m² or less. The indexed EOA overestimates mismatch in obesity, so with a BMI of 30 kg/m² or more the cut-offs are 0.70 and 0.55 cm²/m².

High-flow states, mismatch, obstruction above or below the valve and pressure recovery should be excluded as causes of a high gradient; the velocity cut-offs of the table hold for a normal stroke volume, 50–90 mL. For a peak velocity above 3 m/s, the ASE algorithm reads the contour and the DVI. An early peak (acceleration time below 100 ms, AT/ET below 0.37) with a DVI of 0.30 or more indicates a normal prosthesis: an indexed EOA below 0.85 cm²/m² then points to mismatch, and one above it to a high-flow state. A DVI of 0.25–0.29 indicates possible stenosis, and a late peak with a DVI below 0.25 indicates stenosis.

With normal leaflet motion and no thrombus, a high gradient means mismatch, pannus, or both. In the figure, mismatch is the same valve, opening normally, in patients with a larger body surface area and the same stroke volume index.

TEE, fluoroscopy and CT

When symptoms or signs suggest prosthetic dysfunction, TEE, gated cardiac CT or fluoroscopy is recommended, even if TTE shows no dysfunction. Strong reflections obscure the motion of mechanical leaflets on TTE in most patients, and fluoroscopy or cine-CT is recommended to assess it; on CT, a bileaflet valve normally opens to 73–90°.

Contrast CT can separate thrombus from pannus: thrombus is more common early after surgery, usually lies on the aortic side and measures less than 200 HU; pannus forms late, usually on the ventricular side, and measures more than 200 HU. In a stenotic bioprosthesis, a thin layer of thrombus on the cusps can cause the obstruction and can resolve with oral anticoagulation; 3D TEE or 4D CT can detect it.

Paravalvular regurgitation

In a surgical valve, a paravalvular leak arises from dehiscence of the sewing ring, and its jet arises and runs outside the ring. The share of the ring's circumference that the jets occupy grades the leak, together with the vena contracta: less than 10% is mild, 10–29% moderate and 30% or more severe. A normal bileaflet valve has small washing jets inside the sewing ring and in the centre.

Key points

  1. The EOA is compared with the reference of the valve's type and size; the LVOT diameter is measured, not taken from the label size.
  2. Significant stenosis needs a flow-dependent measure (peak velocity ≥4 m/s or mean gradient ≥35 mmHg) and a flow-independent one (DVI <0.25 or EOA 2 SDs below the reference).
  3. A late-peaking, rounded jet with an acceleration time above 100 ms and a low DVI suggests stenosis; an early peak, a normal DVI and a small indexed EOA suggest mismatch.
  4. Fluoroscopy or CT shows the motion of mechanical leaflets, and CT separates thrombus from pannus.

Infective endocarditis

Vegetations, leaflet perforation and the echocardiographic criteria

Echocardiography shows the lesions of infective endocarditis: the vegetation, and the destruction that it causes, such as leaflet perforation and abscess. The size and mobility of a vegetation predict embolism, and a length of 10 mm is the threshold in the ESC recommendations for surgery.

Frame

The echocardiographic criteria

In the 2023 Duke-ISCVID criteria, echocardiography or cardiac CT that shows a vegetation, a valvular or leaflet perforation, a valvular or leaflet aneurysm, an abscess, a pseudoaneurysm or an intracardiac fistula is a major criterion. Significant new valvular regurgitation on echocardiography and a new partial dehiscence of a prosthetic valve, compared with previous imaging, are major criteria too; worsening or a change of preexisting regurgitation is not sufficient. The 2023 ESC criteria count the lesions characteristic of IE on echocardiography, cardiac CT, [18F]FDG-PET/CT or WBC SPECT/CT as one major imaging criterion.

The ESC defined the lesions on echocardiography as follows:

  • Vegetation. An oscillating or non-oscillating intracardiac mass on a valve or another endocardial structure, or on implanted intracardiac material.
  • Perforation. An interruption of endocardial tissue continuity traversed by color Doppler flow.
  • Abscess. A thickened, non-homogeneous perivalvular area with an echodense or echolucent appearance.
  • Pseudoaneurysm. A pulsatile perivalvular echo-free space with flow on color Doppler.
  • Fistula. Color Doppler communication between two neighboring cavities through a perforation.
  • Valve aneurysm. A saccular bulging of valvular tissue.

TTE and TOE

TTE is recommended as the first-line imaging modality in suspected IE. TOE is recommended when TTE is negative or nondiagnostic and the clinical suspicion of IE remains, in suspected IE with a prosthetic valve or an intracardiac device, and after a positive TTE, except in isolated right-sided native valve IE with a TTE of good quality and unequivocal findings. When the first examination is negative or inconclusive and the suspicion remains high, repeating TTE or TOE within 5–7 days is recommended.

TTE has limits for perivalvular complications, small vegetations, prosthetic valves and device leads. For leaflet perforation, the estimated sensitivity is 45% for TTE and 95% for TOE, with a specificity of 98% for both.

The vegetation

A vegetation lies typically on the atrial side of an atrioventricular valve or on the ventricular side of the aortic valve. It is usually amorphous, shaggy or lobulated, with the echo texture of myocardium; a healed vegetation is brighter and often calcified. It moves with a high-frequency flutter, independent of the motion of the valve. The size of a vegetation is its maximal length.

Size, mobility and embolism

Embolic events affect 20–50% of patients with IE, and they may be clinically silent in up to 50% of patients. The risk is highest in the days around the diagnosis and falls within the first 2 weeks of antibiotic therapy. The size and mobility of the vegetation are the most important independent predictors of a new embolic event; a location on the mitral valve, a change of size under antibiotic therapy and S. aureus also raise the risk. The greatest risk appears to be with vegetations of 10 mm or more on the anterior mitral leaflet, and the risk of neurological complications is particularly high with vegetations longer than 30 mm.

In the studies of embolic risk, a highly mobile vegetation was pedunculated and prolapsed across the coaptation plane: a mitral vegetation prolapses into the LV in diastole and into the LA in systole.

Surgery to prevent embolism

The ESC recommendations use a vegetation length of 10 mm:

  • Urgent surgery is recommended in aortic or mitral IE with a persistent vegetation of 10 mm or more after one or more embolic episodes despite appropriate antibiotic therapy (class I).
  • Urgent surgery is recommended in IE with a vegetation of 10 mm or more and another indication for surgery (class I).
  • Urgent surgery may be considered in aortic or mitral IE with a vegetation of 10 mm or more, without severe valve dysfunction or clinical evidence of embolism, at low surgical risk (class IIb).

Urgent surgery is surgery within 3–5 days. The AHA statement uses mobile vegetations longer than 10 mm: in native valve IE, early surgery is reasonable with such a vegetation and severe valve regurgitation (class IIa).

Perforation and acute regurgitation

Leaflet perforation, leaflet rupture and mitral chordal rupture cause new severe regurgitation, or worsen regurgitation already present, with acute heart failure. Urgent surgery is recommended in aortic or mitral IE with severe acute regurgitation that causes symptoms of heart failure or echocardiographic signs of poor hemodynamic tolerance (class I), and emergency surgery, within 24 h, when it causes refractory pulmonary edema or cardiogenic shock (class I).

In acute MR, the low blood pressure and the high LA pressure lower the driving pressure, so the jet is slower; it is usually markedly eccentric, so color Doppler can underestimate the MR. Systolic flow reversal in the pulmonary veins is usually present (bonus chapter B6). The guideline's Doppler methods for the severity of MR apply to chronic, not to acute severe MR, and TOE may identify acute severe MR better. The figure grades the perforation jet by its vena contracta with the cut-offs of chronic MR: below 0.3 cm mild, and 0.7 cm or more severe (chapter 17).

Differential diagnosis

Echocardiography should distinguish the vegetation of IE from a non-bacterial thrombotic vegetation and benign intracardiac masses. Lambl excrescences, which were not related to systemic embolism in a TEE study, and the papillary fibroelastoma are described in bonus chapter B5; on a valve, a fibroelastoma lies typically on the aortic side of the aortic valve or on the ventricular side of the mitral valve, the opposite of the typical location of IE. Libman–Sacks vegetations, the non-bacterial thrombotic vegetations of systemic lupus erythematosus and the antiphospholipid syndrome, are rarely associated with valve dysfunction and never with valve perforation. Previous scarring and severe myxomatous change can be indistinguishable from active lesions.

Key points

  1. A vegetation, perforation, aneurysm, abscess, pseudoaneurysm or fistula on echocardiography or CT is a major Duke-ISCVID criterion.
  2. TOE is recommended when TTE is negative or nondiagnostic and suspicion remains, with a prosthetic valve or a device, and after a positive TTE, except in isolated right-sided native valve IE with a clear TTE.
  3. Size, the maximal length, and mobility best predict embolism; 10 mm is the length in the ESC recommendations for urgent surgery.
  4. In acute MR from a perforation, color Doppler can underestimate the eccentric jet; systolic flow reversal in the pulmonary veins supports severe MR.

Diseases of the aorta

Root size, aneurysm, dissection and coarctation

Echocardiography measures the aortic root and the ascending aorta against normal values and surgical thresholds. It also shows the flap of a dissection and its complications, and the Doppler signs of coarctation.

Disease

Measuring the root and the ascending aorta

The root and proximal ascending aorta are imaged best in the left parasternal long-axis view. The annulus is measured at midsystole, inner edge to inner edge (I-I). The sinuses of Valsalva at their largest diameter, the sinotubular junction (STJ) and the proximal ascending aorta are measured at end-diastole, leading edge to leading edge (L-L), perpendicular to the aortic long axis. CT and MRI measure I-I, and the echocardiographic L-L diameter is on average 2 mm larger than the I-I diameter on CT.

Lang 2015 gives mean diameters in men: the annulus 2.6 ± 0.3 cm, the sinuses 3.4 ± 0.3 cm, the STJ 2.9 ± 0.3 cm and the ascending aorta 3.0 ± 0.4 cm. The figure draws the normal ranges as the mean ± 2 SD and measures the ascending aorta 1.5 cm above the STJ. In Goldstein 2015, the upper limit of normal by age and BSA lies 2 SD above the predicted mean, and a Z score of 2 or more is dilated. For a man aged 50–59 years at a BSA of 2.0 m², the mean is 3.6 cm and the upper limit 4.0 cm. The figure gives his sinus Z score.

Dilation and aneurysm

The 2022 ACC/AHA guideline calls a diameter of 4.0–4.4 cm dilated and one of 4.5 cm or more an aneurysm. Without symptoms, surgery on the root or the ascending aorta is indicated at 5.5 cm or more (class 1), and is reasonable at 5.0 cm or more with experienced surgeons in a Multidisciplinary Aortic Team (2a). Growth of 0.3 cm/year or more in 2 consecutive years, or of 0.5 cm or more in 1 year, confirmed by tomographic imaging, also indicates surgery (class 1). At surgery on a tricuspid aortic valve, replacement of an ascending aorta of 4.5 cm or more is reasonable with experienced surgeons (2a).

With a bicuspid aortic valve, the same 5.5-cm threshold applies. At 5.0–5.4 cm, surgery is reasonable with a risk factor for dissection (2a): a family history of aortic dissection, growth of 0.3 cm/year or more, aortic coarctation, or the root phenotype. Without one, at low surgical risk, it may be reasonable (2b). At aortic valve surgery, replacement of a root or an ascending aorta of 4.5 cm or more is reasonable with experienced surgeons (2a), and from 4.0 cm lifelong surveillance imaging is recommended (class 1).

Aortic dissection

The diagnostic hallmark of dissection is a mobile flap that separates the true and the false lumen. The flap moves independently of the aorta, is seen in more than one view and is clearly distinct from reverberations. In systole the true lumen expands, and the flap typically moves toward the false lumen. In the figure, the entry tear lies beyond the view.

Reverberations, especially in the ascending aorta, can mimic a flap. In the figure, the reverberation of the pericardium in front of the aorta lies at twice its depth (chapter 02), moves with it, and runs across the lumen into the posterior wall. From the zoomed window, one space higher, it lies elsewhere, and on the M-mode it follows the pericardium at twice its excursion. A flap stays in the aorta and moves on its own.

AR occurs in about 50% of patients with type A dissection. Most often, the dilated root tethers the cusps, so that they do not close fully. A flap that extends into the sinuses can detach the commissures, so that the cusps prolapse in diastole. Less often, a long flap prolapses through the valve into the LVOT. An eccentric jet often points away from the cusp at fault. Along the slider, the figure shows the three mechanisms in turn. It grades the AR by its vena contracta: below 0.3 cm mild, above 0.6 cm severe (chapter 17). A pericardial effusion in ascending dissection indicates a poor prognosis and suggests rupture of the false lumen into the pericardium.

With harmonic imaging, TTE detects about 85% of type A dissections and is less sensitive for type B. A negative TTE does not exclude dissection. In a meta-analysis, TEE had a sensitivity of 98% and a specificity of 95%.

Coarctation

Coarctation most commonly lies just distal to the left subclavian artery. The suprasternal view with color flow often finds it, but TTE often images the arch and the proximal descending aorta poorly. In a significant coarctation, the CW gradient persists into diastole: the diastolic tail. PW Doppler of the abdominal aorta then shows reduced, delayed systolic flow and forward flow through diastole.

The ACC/AHA requires upper-extremity hypertension or LVH and one of three findings above 20 mmHg: the arm–leg systolic pressure difference, the catheter peak-to-peak gradient or the mean Doppler gradient. With reduced LV function or significant collateral flow, a gradient above 10 mmHg counts. For the ESC, an arm–leg difference of 20 mmHg or more, a diastolic tail, diastolic forward flow in the abdominal aorta, or a catheter peak-to-peak gradient of 20 mmHg or more without well-developed collaterals indicates a significant coarctation. The ESC does not use Doppler gradients: collaterals make them unreliable and often low, and after repair or stenting they are overestimated. It considers stenting in a hypertensive patient with a narrowing of 50% or more relative to the aorta at the diaphragm, even with a peak-to-peak gradient below 20 mmHg (IIa).

The figure compares the narrowest lumen with the abdominal aorta below the diaphragm. Its patient has upper-extremity hypertension, normal LV function and no significant collateral flow, and every criterion of both guidelines turns at the same point of the slider. The mean gradient is 4V² averaged over the systolic envelope.

Key points

  1. The sinuses, STJ and ascending aorta are measured L-L at end-diastole, the annulus I-I at midsystole.
  2. A root or ascending aorta of 4.0–4.4 cm is dilated, and one of 4.5 cm or more an aneurysm. Surgery is indicated at 5.5 cm, with a tricuspid or a bicuspid valve.
  3. A dissection flap moves independently of the aorta and is seen in more than one view. A negative TTE does not exclude dissection.
  4. In a significant coarctation, the CW gradient persists into diastole. The ACC/AHA counts a mean Doppler gradient above 20 mmHg; the ESC uses no Doppler gradient.

Pericardial disease

Effusion, tamponade and constriction

A pericardial effusion compresses the heart once the pressure in the sac reaches the pressure in the right heart, a condition termed tamponade. Echocardiography grades the effusion and shows the signs of tamponade. Less often, a thick, rigid pericardium fixes the volume of the heart: constrictive pericarditis.

Disease

Effusion size and progression to tamponade

  1. None. The normal pericardial sac contains 10–50 mL of fluid. A separation of the pericardial layers seen only in systole is a trivial effusion; a separation in both systole and diastole indicates more than 50 mL of fluid.
  2. Mild (small). The echo-free space between the epicardium and the parietal pericardium, measured at end-diastole, is less than 10 mm. The ASE guideline assigns 50–100 mL to a small effusion and describes these volumes as arbitrary.
  3. Moderate. The echo-free space measures 10–20 mm, which corresponds to approximately 100–500 mL. In this model, the pressure in the sac remains below the pressure in the right heart, and at most a brief RA inversion occurs.
  4. Severe (large). The echo-free space exceeds 20 mm; the ASE guideline defines an additional very large category of more than 25 mm. The heart can swing within the fluid, and the ESC guideline associates this swinging motion with electrical alternans on the ECG.
  5. Tamponade. The pressure in the sac reaches the pressure in the right heart. A cardiac chamber collapses during its relaxation phase, when the pressure within it falls below the pressure in the sac.

Echocardiographic signs of tamponade

  • Right atrium. The RA wall inverts near the peak of the R wave and remains inverted until atrial filling during ventricular systole raises the atrial pressure. RA collapse for more than one third of the cardiac cycle is nearly 100% sensitive and specific for tamponade. In the original study, an RA collapse time of more than 0.34 of the cardiac cycle had a sensitivity of 94% and a specificity of 100%.
  • Right ventricle. The RV free wall collapses in early diastole, after the T wave. RV diastolic collapse occurs when the cardiac output has decreased by about 20% but the systemic blood pressure has not fallen.
  • Left atrium. LA collapse also occurs in about one quarter of patients with tamponade and is a highly specific sign.
  • IVC. The IVC is wider than 2.1 cm and collapses by less than 50% with inspiration. This finding is present in more than 90% of patients with tamponade, but many other cardiac diseases also cause it. The ESC 2025 guideline uses an IVC diameter cut-off of 20 mm, which has a sensitivity of 97% and a specificity of 40%. Chapter 07 shows the measurement of the IVC and the RA pressure that it gives.
  • Respiratory variation of inflow. With inspiration, the mitral E velocity falls by more than 25–30% and the tricuspid E velocity increases by more than 40–60%. The RV enlarges and the LV becomes smaller during inspiration, and the reverse occurs during expiration.
  • Hepatic veins. Diastolic forward flow in the hepatic veins decreases or reverses on the first beat of expiration. When the IVC is difficult to assess, dilated hepatic veins confirm a raised systemic venous pressure. Chapter 07 shows the normal hepatic vein waves.

Pitfalls

  • Effusion size does not define tamponade; the rate of fluid accumulation is more important than the volume. Rapid accumulation, as in hemopericardium, can cause tamponade at 200–300 mL, whereas a slowly accumulating effusion can reach 1–2 L before tamponade develops.
  • Tamponade is a clinical diagnosis based on the history, symptoms and signs and confirmed by echocardiography. Pulsus paradoxus is an inspiratory fall in systolic blood pressure of more than 10 mmHg.
  • A brief RA inversion also occurs in the absence of tamponade, so the duration of the inversion should be measured. An M-mode recording through the RA wall displays the timing most clearly.
  • The absence of chamber collapse has a negative predictive value of more than 90% for tamponade. RV hypertrophy, severe pulmonary hypertension or severe LV dysfunction can delay or prevent chamber collapse.
  • Pericardial fluid is distinguished from pleural fluid in the parasternal long-axis view, in which pericardial fluid lies between the descending aorta and the heart and pleural fluid extends posterior to the descending aorta.
  • Respiratory variation of inflow is not a diagnostic criterion on its own. During positive-pressure ventilation, the variation is minimal, even in tamponade.
  • In effusive-constrictive pericarditis, fluid lies between a thickened visceral and parietal pericardium, and after pericardiocentesis the RA pressure does not fall by 50% or to below 10 mmHg.

Constrictive pericarditis

In constrictive pericarditis a thickened, scarred and often calcified pericardium fixes the total volume of the heart, so the diastolic pressures of the chambers rise and equalize. The inspiratory fall in intrathoracic pressure reaches the pulmonary veins but not the heart chambers, so LV filling falls with inspiration, RV filling rises and the septum shifts toward the LV. Expiration reverses both, and blood flows back into the hepatic veins.

  • Septum. The septum shifts toward the LV with inspiration and moves abruptly toward the LV in early diastole, the septal bounce. Without a plethoric IVC and a respiratory septal shift, constriction is unlikely.
  • Inflow. With inspiration the mitral E velocity falls by more than 25% and the tricuspid E velocity rises by more than 40%.
  • Annulus and hepatic veins. The medial mitral e′ is normal or increased. In expiration the hepatic vein flow reverses at end-diastole; the reversal ratio is the end-diastolic reversal velocity ÷ the diastolic forward velocity.
  • Pericardium. The normal pericardium is 1–2 mm thick on CT. A thickness above 4 mm on CT or CMR supports constriction, and TTE is unreliable for measuring it. Up to 20% of patients with constriction have a pericardium of normal thickness.

In the Mayo Clinic series of surgically confirmed constriction, a respiratory septal shift with a medial e′ of 9 cm/s or more, or with a hepatic vein expiratory diastolic reversal ratio of 0.79 or more, had a sensitivity of 87% and a specificity of 91%. The guidelines give the septal shift no size; this page calls it present from 3 mm.

Constriction or restrictive cardiomyopathy

In restrictive cardiomyopathy, for example cardiac amyloidosis (chapter 25), the stiff myocardium, not the pericardium, limits filling. The septal e′ is usually 5 cm/s or less, and the marked respiratory changes in mitral and tricuspid E do not occur.

Key points

  1. Effusion size is graded by the end-diastolic echo-free space: mild <10 mm, moderate 10–20 mm and severe (large) >20 mm. The rate of fluid accumulation, rather than the size of the effusion, determines how well the effusion is tolerated.
  2. RA collapse for more than one third of the cardiac cycle and RV free wall collapse in early diastole indicate tamponade physiology. Tamponade is a clinical diagnosis.
  3. A dilated IVC that collapses little is present in more than 90% of patients with tamponade, but many other cardiac diseases also cause it.
  4. In constriction, inspiration shifts the septum toward the LV and lowers mitral E. The Mayo Clinic criteria pair the septal shift with a medial e′ of 9 cm/s or more or a hepatic vein reversal ratio of 0.79 or more.

Cardiac amyloidosis

Echocardiographic signs

In cardiac amyloidosis, amyloid fibrils accumulate between the myocardial cells. The LV walls thicken around a small cavity, LV filling becomes restrictive, and the base loses longitudinal shortening before the apex. These echocardiographic findings raise the suspicion of cardiac amyloidosis.

Structural findings

  • LV wall thickness. The LV wall thickness is 12 mm or more in the absence of another cause, such as aortic valve disease or hypertension. Used alone, this cut-off has high sensitivity and low specificity.
  • LV cavity. The LV cavity is small and the relative wall thickness is high. In a study of 1,187 patients, concentric remodeling was among the best single diagnostic signs.
  • Atria and interatrial septum. Both atria enlarge; an LA volume index of more than 34 mL/m² is abnormal. An interatrial septum thicker than 5 mm is characteristic, and the valve leaflets thicken.
  • Right ventricle. The RV free wall is measured at end-diastole in the parasternal long-axis or subcostal view. A free wall thickness of more than 5 mm indicates RV hypertrophy. RV hypertrophy together with a thick LV wall suggests an infiltrative disease.
  • Pericardium. A pericardial effusion is present in more than half of patients but is not specific.
  • Myocardial texture. A granular, “sparkling” or “speckled” myocardium was long described as a sign of amyloidosis. The BSE advises against the term, because other diseases produce the same appearance and harmonic imaging (chapter 02) confounds it.

Doppler findings

  • Diastolic dysfunction progresses from slowed relaxation with a normal filling pressure (grade 1) to restrictive filling with an E/A ratio of 2 or more (grade 3) (chapter 11).
  • A clear restrictive filling pattern seldom appears before the late stages of the disease. In these stages, the deceleration time falls below 150 ms and the septal and lateral e′ velocities fall to 3–4 cm/s.
  • The “5-5-5” sign, in which the septal s′, e′ and a′ velocities are all below 5 cm/s, is one of the three findings of the ESC echocardiographic criteria.
  • A small A wave suggests reduced atrial function and a higher risk of atrial thrombus.

Longitudinal strain

  • Longitudinal strain is reduced most at the base. On the bull’s-eye plot (chapter 10), the apical segments remain red while the basal segments become pale, a pattern termed relative apical sparing.
  • Relative apical LS is a ratio of regional strain values: the mean apical strain divided by the sum of the mean basal and mean mid-ventricular strain. In the original study, a value of 1.0 or more distinguished amyloidosis from hypertrophic cardiomyopathy and aortic stenosis with a sensitivity of 93% and a specificity of 82%.
  • A multicenter study found apical sparing in 32% of patients in whom amyloidosis was suspected and then excluded, and in 6% of healthy individuals.
  • The base-to-apex strain gradient corresponds to the total amyloid mass in each region, which is largest at the base.
  • An EF ÷ |GLS| ratio of more than 4.1 distinguished amyloidosis from other causes of increased LV wall thickness with a sensitivity of 89.7% and a specificity of 91.7%. A normal EF can mask impaired long-axis function.
  • GLS is normal when more negative than −18% and abnormal when less negative than −16% (chapter 09). The ESC criteria use a stricter cut-off: an absolute GLS below 15%.

ESC 2021 echocardiographic criteria

The criteria require an unexplained LV wall thickness of 12 mm or more together with either two of the three findings or a score of 8 or more; the diagram above applies them to the values on screen. The score assigns points for a thick wall around a small cavity, a high E/e′, a low TAPSE (chapter 09), a low GLS and relative sparing of the apical septum. The criteria raise the suspicion of cardiac amyloidosis. In the ESC diagnostic pathways, they are used together with other tests.

Measurement

  • Wall thickness is measured at end-diastole, perpendicular to the LV long axis, at the level of the mitral leaflet tips.
  • In the score, relative wall thickness is calculated as (IVS + PW) ÷ LVIDd; the ASE guideline defines it as 2 × PW ÷ LVIDd, with a cut-off of 0.42.

Key points

  1. An LV wall thickness of 12 mm or more without another cause, a small LV cavity and enlargement of both atria suggest cardiac amyloidosis.
  2. Restrictive filling, septal s′, e′ and a′ velocities below 5 cm/s and relative apical sparing of longitudinal strain support the diagnosis.
  3. The echocardiographic criteria raise the suspicion of cardiac amyloidosis but do not establish the diagnosis alone.

Hypertrophic cardiomyopathy

Septal hypertrophy, SAM and outflow obstruction

In hypertrophic cardiomyopathy (HCM), the LV wall is thick without another cause, most often at the basal anterior septum. In most patients, systolic anterior motion of the mitral valve obstructs the LV outflow tract, at rest or only with provocation.

Maneuver
Frame

Definition and measurement

In an adult, HCM is defined by a maximal end-diastolic wall thickness of 15 mm or more anywhere in the LV, without another cause of hypertrophy. A wall of 13–14 mm can be diagnostic in a family member of a patient with HCM or with a positive genetic test. The normal septum and posterior wall measure 6–9 mm in women and 6–10 mm in men.

The most common pattern is focal asymmetric hypertrophy of the basal anterior septum, defined as a septal to posterior wall thickness ratio above 1.3 in a normotensive patient. The variants are a sigmoid septum, reversed septal curvature, and concentric, mid-wall and apical hypertrophy. RV trabeculations, the moderator band and the crista supraventricularis are excluded from the septum. A long-axis view can cut the wall tangentially and overestimate it, so the short- and long-axis views are compared.

SAM and dynamic obstruction

Obstruction of the LV outflow tract (LVOT) is caused mainly by systolic anterior motion (SAM) of the mitral valve. Drag forces of the flow push the anterior leaflet toward the septum, and SAM can begin at a normal LVOT velocity. Most patients with obstruction have abnormal mitral leaflets or papillary muscles; elongated leaflets predispose to SAM. SAM is not specific to HCM: a low afterload, a low preload or a high inotropic state can also cause it.

On M-mode through the mitral valve, SAM is mild when the leaflet stays more than 10 mm from the septum. It is moderate at 10 mm or less, or with contact for less than 30% of systole, and severe with contact for 30% of systole or more. With simultaneous catheterization, SAM without septal contact went with no gradient or a gradient below 10 mmHg, and contact always went with a gradient above 10 mmHg. The earlier the contact began, the longer it lasted and the higher the gradient was: 25 × (the duration of contact ÷ the time from the onset of SAM to contact) + 25 mmHg.

LVOT gradient and provocation

  • The peak LVOT velocity is recorded with CW Doppler, and the gradient is 4 × velocity². Obstruction is present at a peak gradient of 30 mmHg or more.
  • The obstruction is dynamic: it varies with preload, afterload and contractility. When the resting peak gradient is below 50 mmHg, the echocardiogram is repeated with provocation: standing, the strain phase of the Valsalva maneuver or exercise. The Valsalva effort varies, and its gradient is generally lower than an exercise gradient.
  • About 30–35% of symptomatic patients have obstruction at rest, and another 30–35% have latent obstruction, present only with provocation.
  • Exercise echocardiography (chapter 13) is recommended for symptomatic patients without a resting or provoked gradient of 50 mmHg or more. A resting or provoked gradient of 50 mmHg or more is the threshold for advanced drug or invasive therapy when symptoms persist despite standard therapy.

The LVOT jet and the MR jet

  • The LVOT velocity rises slowly in early systole, then rises abruptly and peaks in mid-to-late systole, a dagger-shaped envelope. In aortic stenosis or a discrete subaortic membrane, the envelope peaks earlier, and the absence of SAM suggests a fixed obstruction (chapter 16).
  • MR usually accompanies SAM, and its jet lies close to the LVOT. The CW beam is swept from the LVOT into the MR jet, and each signal is recorded and labeled. Compared with the LVOT jet, the MR jet usually peaks earlier and can last longer, its envelope is rounder, and its velocity is always higher. A velocity above 5.5 m/s is taken as LVOT flow only with caution.
  • The MR jet is eccentric and directed posteriorly and laterally, and it is typically mid-to-late systolic. A central or anterior jet prompts a search for an intrinsic abnormality of the mitral valve, although SAM alone can also produce such a jet. The MR varies with the obstruction, so both are assessed at rest and with provocation. The MR is graded as in chapter 19: a vena contracta below 0.3 cm is mild and one of 0.7 cm or more is severe.

LV function, the LA and risk

  • The LVEF is normal to hyperdynamic in most patients. An LVEF below 50% defines LV dysfunction.
  • Four measurements estimate the LA pressure in HCM: an average E/e′ above 14, an LA volume index above 34 mL/m², an Ar−A duration of 30 ms or more and a peak TR velocity above 2.8 m/s (chapter 11).
  • Three of the major risk factors for sudden death are echocardiographic: a maximal wall thickness of 30 mm or more in any segment, an LV apical aneurysm and an LVEF below 50%.

Differential diagnosis

Asymmetric hypertrophy and dynamic obstruction are not pathognomonic of HCM.

  • Athlete’s heart. The wall is typically thinner than 15 mm, the four chambers dilate in balance, and the diastolic function is normal or supranormal. A dilated LV with uniform thickening, a normal mitral valve and no obstruction at rest or with exercise favor physiologic hypertrophy.
  • Hypertension. Hypertensive heart disease most commonly gives concentric hypertrophy or remodeling, and the ratio of 1.3 applies to a normotensive patient.
  • Cardiac amyloidosis. The LV wall thickens concentrically, sometimes more at the septum. Global longitudinal strain falls with relative apical sparing, and the QRS voltage is low for the wall thickness (chapter 25).

The figure

The contact timing sets the gradient by the regression of Pollick. The Valsalva switch shows the strain phase, with earlier contact and a higher gradient. The two CW strips share one velocity scale. The MR strip records both jets, as a beam between them does: the MR envelope and, inside it, the brighter LVOT envelope. The patient and the numbers are illustrative.

Key points

  1. HCM is a maximal end-diastolic LV wall thickness of 15 mm or more without another cause; 13–14 mm can be diagnostic in a family member or with a positive genetic test.
  2. SAM causes dynamic LVOT obstruction; contact with the septum for 30% of systole or more is severe SAM.
  3. Obstruction is a peak LVOT gradient of 30 mmHg or more, at rest or with provocation. A resting gradient below 50 mmHg calls for provocation.
  4. On CW Doppler, the LVOT jet is dagger-shaped and peaks late. The MR jet peaks earlier, is rounder and is always faster.

Strain

Global longitudinal strain by speckle tracking, its patterns, and cardio-oncology

Longitudinal strain is the shortening of the myocardium from end-diastole to end-systole, as a percentage of its length at end-diastole. Global longitudinal strain (GLS) can fall while the LVEF is still normal. During cancer therapy, its relative fall from baseline signals cardiac dysfunction. Relative apical sparing characterizes cardiac amyloidosis.

Figure
Pattern

Strain and speckle tracking

Strain is the change in length of the myocardium as a fraction of its length at a reference time, usually end-diastole: S = (L − L0) ÷ L0. Shortening gives a negative strain, so GLS becomes less negative as LV function deteriorates. GLS is the change in myocardial length between end-diastole and end-systole, measured in the four-, two- and three-chamber views and averaged. It uses the length of the whole myocardial line.

Speckle tracking follows the speckle pattern of the image from frame to frame, and assumes that it moves with the tissue. The region of interest is drawn at end-diastole; end-systole is aortic valve closure, and the end-systolic strain is the default value to report. GLS should not be calculated when the tracking is suboptimal in more than two segments of one view.

In the figure, the region of interest is the myocardial midline of each apical view, from base to base over the apex, each wall divided at end-diastole into three equal segments. The bull's-eye has 18 segments, six from each view; the 17-segment model of chapter 11 has four apical segments and the apex.

Normal values

A peak GLS of about −20% can be expected in a healthy person. The 2025 ASE/EACVI consensus calls GLS normal when it is more negative than −18%, borderline from −16% to −18%, and abnormal when it is less negative than −16%. The values differ between vendors, by up to 3.7 strain units, so serial studies should use the same machine and software.

The figure measures the LVEF by the biplane method of disks (chapter 09). The patient is a woman, so her LVEF is graded by the ranges for women: normal 54–74%, mildly abnormal 41–53%, moderately abnormal 30–40% and severely abnormal below 30%. The patient and the numbers are illustrative.

Patterns of strain

When the LV mass is increased, the distribution of abnormal strain may give clues to the cause: impaired septal strain in hypertrophic cardiomyopathy, mostly basal and mid impairment in hypertensive heart disease, and prominent apical sparing in cardiac amyloidosis.

In the Global pattern, every segment loses function together. The long-axis shortening falls first, so GLS becomes abnormal while the LVEF is still normal; then the LVEF falls.

In the Regional pattern, the seven segments of the LAD territory lose function first, to akinesis; at the end of the slider, the other segments lose function too. The territories and wall motion are in chapter 11, and ischemia under stress in chapter 13. Regional strain values vary too much between repeated tests and between vendors to be used clinically.

In the Apical sparing pattern, the basal and mid segments lose their longitudinal shortening while the apical segments keep theirs, and GLS falls. This pattern, relative apical sparing, characterizes cardiac amyloidosis. Late in the slider, the basal and mid segments also lose their motion across the long axis, and the LVEF falls. Relative apical LS is the mean apical strain divided by the sum of the mean basal and mean mid strain, without the signs. In the original study, a value of 1.0 or more distinguished cardiac amyloidosis from hypertrophic cardiomyopathy and aortic stenosis. Apical sparing also occurs without amyloidosis; the diagnosis of cardiac amyloidosis is in chapter 27.

Cardio-oncology

GLS falls early during treatment with anthracyclines, trastuzumab or radiotherapy, even when the LVEF is unchanged, and the early fall predicts a later fall in the LVEF. The 2022 ESC guideline supports the definitions of cancer therapy-related cardiac dysfunction (CTRCD) of the International Cardio-Oncology Society. Symptomatic CTRCD is heart failure; asymptomatic CTRCD is graded by the LVEF, GLS and the cardiac biomarkers:

  • Mild. An LVEF of 50% or more with a new relative decline in GLS of more than 15% from baseline and/or a new rise in cardiac biomarkers.
  • Moderate. A new fall of the LVEF by 10 percentage points or more, to 40–49%; or a new fall by less than 10 points, to 40–49%, with either a new relative decline in GLS of more than 15% or a new rise in cardiac biomarkers.
  • Severe. A new fall of the LVEF to below 40%.

A new rise in cardiac biomarkers is a troponin I or T above the 99th percentile, a BNP of 35 pg/mL or more, an NT-proBNP of 125 pg/mL or more, or a new significant rise from baseline beyond the variation of the assay. The guideline's cut-off of 15% improves specificity. In the 2014 ASE/EACVI consensus, a relative fall of less than 8% from baseline appears not to be meaningful, and a fall of more than 15% is very likely abnormal; an abnormal GLS should be confirmed by a repeat study 2 to 3 weeks later. The 2025 strain consensus considers a relative change of 10% to 15% on serial studies likely to be significant.

In the ESC guideline, echocardiography is the first-line modality for cardiac function in patients with cancer; 3D echocardiography is the preferred method for the LVEF, and GLS is recommended in every patient who has echocardiography, if available, at baseline and serially.

In the SUCCOUR trial, patients treated with anthracyclines were randomized to start cardioprotective therapy on a relative fall in GLS of 12% or more, or on a fall in the LVEF of more than 10 percentage points. The change in the LVEF, the primary outcome, did not differ between the arms at 1 year or at 3 years; at 1 year, fewer patients in the GLS-guided arm met the trial's criteria for CTRCD.

Key points

  1. Longitudinal strain is (L − L0) ÷ L0 from end-diastole, negative for shortening. GLS can fall while the LVEF is still normal.
  2. GLS is abnormal when less negative than −16%. Vendors differ, so serial studies use the same machine and software.
  3. A relative apical LS of 1.0 or more distinguished cardiac amyloidosis from hypertrophic cardiomyopathy and aortic stenosis; relative apical sparing also occurs without amyloidosis.
  4. During cancer therapy, a new relative decline in GLS of more than 15% with an LVEF of 50% or more is mild asymptomatic CTRCD; a new fall of the LVEF to below 40% is severe.

Stress echocardiography

Dobutamine stress, ischemia and viability

Stress echocardiography compares the wall motion at rest with the wall motion during stress. A segment that is normal at rest and becomes abnormal with stress indicates ischemia in the territory of its coronary artery.

Case

Principle

Stress increases the oxygen demand of the myocardium. Beyond a flow-limiting coronary stenosis, the subendocardial blood flow falls with stress, and the wall of that territory thickens less and moves inward less. In the ischemic cascade, myocardial contractility decreases before the ST segment changes and before angina occurs, and perfusion abnormalities occur before wall motion abnormalities.

Dobutamine protocol

  • Exercise is the preferred stress for a patient who can exercise, because the test also measures the exercise capacity. Dobutamine is the alternative for a patient who cannot exercise, and the preferred agent for the assessment of viability.
  • Dobutamine starts at 5 µg/kg/min and increases every 3 minutes to 10, 20, 30 and 40 µg/kg/min. When the heart rate does not reach its target, atropine is given in doses of 0.25 to 0.5 mg at 1-minute intervals, to a total of 1.0 to 2.0 mg.
  • The target heart rate is 85% of the age-predicted maximum. The maximum is commonly estimated as 220 − age, as in the figure: for its 60-year-old patient, 160/min, and the target is 136/min. In a meta-analysis of 351 studies (18,712 subjects), 208 − 0.7 × age predicted the maximum better, and 220 − age underestimates it in older adults: for this patient, 166/min, and a target of 141/min. A test that does not reach the target heart rate is less sensitive for ischemia.
  • The test stops at the target heart rate, or for hypotension, new or worsening wall motion abnormalities, significant arrhythmias, severe hypertension or intolerable symptoms.
  • Stress testing is contraindicated in acute coronary syndromes, severe arrhythmias, malignant hypertension, significant LVOT obstruction and symptomatic severe aortic stenosis.

Images

The images of each stage are recorded digitally. The peak images are compared with the rest, low-dose and pre-peak or early recovery images, side by side in a quad-screen format. The figure shows rest, low dose, peak and early recovery, as some laboratories do. Each of its views beats at the heart rate of its stage; systole shortens with the heart rate as total electromechanical systole does at rest, and diastole shortens more. The LVEF and the end-systolic volume in the readouts are measured on the figure's own four- and two-chamber views, by the biplane method of disks, as in chapter 09. The patient and the numbers are illustrative.

An ultrasound enhancing agent (contrast) is used whenever two or more contiguous segments, or a coronary territory, cannot be visualized.

Reading the test

  • Each segment is scored at rest and at each stage: 1, normal or hyperkinetic; 2, hypokinetic; 3, severely hypokinetic or akinetic; 4, dyskinetic; 5, aneurysmal. The wall motion score index is the sum of the scores divided by the number of segments visualized. The segments and their coronary territories are those of chapter 10.
  • Normal. Every segment is normal at rest and with stress. With dobutamine, the normal response is a marked increase in contractility (hyperkinesis) and a smaller LV cavity, from the lower preload and afterload. The absence of hyperkinesis can indicate coronary obstruction, but it is not specific.
  • Ischemic. A new wall motion abnormality with stress in a segment that is normal at rest, or worse function with stress in a segment that is abnormal at rest.
  • Fixed. A severe abnormality at rest that does not change with stress, with no biphasic response: a transmural infarct, or one with a limited epicardial rim of viable myocardium. Akinesis that turns into dyskinesis is a mechanical response of infarcted myocardium, not ischemia.
  • Viable. A dysfunctional segment that improves at low dose has contractile reserve. A biphasic response, improvement at low dose and worsening at higher doses, has the highest positive predictive value for recovery of function after revascularization; segments with sustained improvement are less likely to recover. Remodeled segments, supplied by arteries without severe stenosis, may or may not improve with dobutamine. Contractile reserve in 4 to 5 dysfunctional segments is the minimum that predicts an increase in LVEF of 5% or more and a better outcome with revascularization.

High-risk findings and prognosis

  • Stress-induced wall motion abnormalities in more than one coronary territory, and cavity dilatation, are high-risk findings that the report should note. With dobutamine, a fall in LVEF and a larger end-systolic cavity are less frequent than with exercise, even in left main or multivessel disease.
  • Wall motion abnormalities that occur at a low heart rate or rate–pressure product usually indicate severe stenosis or multivessel disease. Abnormalities that persist into recovery indicate more severe ischemia.
  • In a study of 1,500 patients, the peak wall motion score index separated three groups: an index of 1, with a cardiac event rate of 0.9% a year; an index of 1.1 to 1.7, with 3.1% a year; and an index of 1.7 or more, with 5.2% a year.
  • The earlier ASE guideline reported an average sensitivity of 88% and an average specificity of 83% for coronary stenosis. As with every stress test, the sensitivity is higher in multivessel than in single-vessel disease.

Other uses

Stress echocardiography also answers questions outside coronary disease. In classical low-flow, low-gradient aortic stenosis, low-dose dobutamine tests the flow reserve, an increase in stroke volume of 20% or more (chapter 12). With exercise, an average E/e′ above 14 or a septal E/e′ above 15 indicates a raised filling pressure (chapter 11). In valve disease and in hypertrophic cardiomyopathy, exercise shows the symptoms, the PA systolic pressure and the LVOT gradient; a PA systolic pressure of 60 mmHg or more and an LVOT gradient above 50 mmHg are cut-offs of clinical significance.

Key points

  1. Stress echocardiography compares each segment at rest and with stress. A new or worse wall motion abnormality indicates ischemia.
  2. Dobutamine increases in 3-minute stages from 5 to 40 µg/kg/min, with atropine if needed, until the heart rate reaches 85% of the age-predicted maximum.
  3. Abnormalities in more than one territory, at a low heart rate or that persist into recovery indicate severe or multivessel disease.
  4. A dysfunctional segment that improves at low dose is viable. A biphasic response best predicts recovery of function after revascularization.

Complications of myocardial infarction

Septal rupture, papillary muscle rupture, free-wall rupture and LV aneurysm

An infarcted wall can tear, through the septum, a papillary muscle or the free wall, or it can stretch into an aneurysm. Echocardiography shows each lesion and measures its effect on flow and pressure.

Complication

Mechanical complications

A transmural infarction can rupture the septum, a papillary muscle or the free wall, typically 3 to 5 days after the infarction. Most of these mechanical complications are surgical emergencies, and echocardiography shows each of them. A scar that thins forms an aneurysm. Each lesion lies in the territory of the infarct (chapter 11).

Ventricular septal rupture

A septal rupture occurs in fewer than 0.3% of patients in the era of routine primary revascularization, and without repair the mortality approaches 80% at 30 days. Anterior and apical ruptures follow infarcts in the LAD territory, and posterior ruptures follow inferior infarcts, which are associated with complex ruptures with multiple, irregular connections.

Color Doppler shows the left-to-right flow across the septum: it found all 12 confirmed ruptures, and two-dimensional criteria found 7. The peak velocity of the jet on CW gives the LV–RV gradient as 4V², and the systolic blood pressure minus that gradient is the RV systolic pressure. Chapter 28 applies the same relation to a congenital VSD and measures Qp/Qs from the two outflow tracts.

The shunt overloads the RV with volume, raises the pulmonary blood flow and, in turn, overloads the LA and the LV. A shunt is hemodynamically significant when Qp/Qs is 1.5 or more, or when a chamber downstream of it enlarges; after a septal rupture, Qp/Qs reaches 8:1 at catheterization, depending on the size of the defect. In the figure the rupture grows to 18 mm; in one series the rupture measured 13.9 ± 4.4 mm by echocardiography.

Papillary muscle rupture

Papillary muscle rupture complicates 0.05% to 0.26% of acute infarctions in the reperfusion era. The anterolateral muscle has a dual blood supply; the posteromedial muscle has a single supply, from the circumflex or the right coronary artery. So anterolateral rupture is extremely uncommon, and posteromedial rupture typically follows an inferior or lateral infarction. The posteromedial muscle most commonly has two heads, and the rupture may be partial or complete.

The posteromedial muscle holds the medial half of both leaflets. Its rupture can disrupt either leaflet. A flail leaflet has lost its attachment to the LV, and its tip points toward the roof of the LA; the torn head is a mobile mass in the LV that sometimes prolapses into the LA. In operated patients, transthoracic echocardiography made the diagnosis in 53.8%, and a flail leaflet was seen in every complete rupture and in 40% of partial ones; when the transthoracic study is not diagnostic, TEE has a high sensitivity.

A flail leaflet or a ruptured papillary muscle is specific for severe MR. In acute severe MR, a low blood pressure and a high LA pressure lower the driving pressure, so the jet is slow and color may show little turbulence. The jet is often eccentric, and an eccentric jet looks smaller than a central jet of the same severity. A hyperdynamic LV with a low forward flow supports the diagnosis, the LV and the LA can be of normal size, and the pulmonary veins usually show systolic flow reversal. The Doppler grades of chronic MR (chapter 19) do not apply.

A triangular CW contour with an early peak shows a high LA pressure or a large v wave, but it is not sensitive for severe MR. The systolic blood pressure minus the peak MR gradient estimates the LA pressure.

Free-wall rupture and pseudoaneurysm

Free-wall rupture usually causes sudden death. It presents with tamponade and shock, and echocardiography shows the tamponade and sometimes flow across the defect. Chapter 24 grades the effusion and the signs of tamponade.

When adherent pericardium contains the rupture, a pseudoaneurysm forms; a true aneurysm, in contrast, is a thinned scar. Pseudoaneurysms more often involve the inferior or the lateral wall and usually have a narrow neck. In pseudoaneurysms the width of the neck was at most 0.5 of the largest parallel width of the sac, and the sac extended behind the intact wall; in true aneurysms the ratio was 0.9 to 1.0.

The wall of the sac is thrombus or pericardium without myocardium. Red flags on imaging include a narrow neck and a break in the myocardium. Doppler shows turbulent flow across the neck, and an enhancing agent helps to show the sac; in published cases, echocardiography missed 18.6% of the pseudoaneurysms. A pseudoaneurysm is prone to rupture, and it is a surgical emergency. An effusion that holds clot is hard to assess by TTE; TEE, CT or CMR assess it better.

True aneurysm and thrombus

An aneurysm is a focal dilatation with thinning and an akinetic or dyskinetic wall; the ASE scores it as akinetic or dyskinetic, with no separate score. Its wall is thin scar, most often at the anterior wall or the apex after a total occlusion of the LAD, and it is associated with angina, thrombus, worsening heart failure and ventricular tachyarrhythmia. The mouth of a true aneurysm is wide, nearly as wide as the aneurysm itself.

A thrombus lies in up to 50% of chronic LV aneurysms, and it embolizes less often there, probably because the aneurysm does not contract. Chapter 29 shows the types of LV thrombus and the enhancing agent.

RV infarction

The more proximal a right coronary occlusion, the more RV myocardium the infarct involves, and RV-predominant shock follows a right coronary infarct that involves the RV. McConnell's sign occurs in RV infarction as often as in pulmonary embolism, and S′ assumes that one segment represents the whole RV, which is not likely in a regional disease such as RV infarction. Chapter 14 measures the size and the function of the RV.

Key points

  1. Color Doppler shows a septal rupture's left-to-right flow; the RV systolic pressure is the systolic blood pressure minus 4V² of the jet.
  2. Papillary muscle rupture usually involves the posteromedial muscle, after an inferior or lateral infarction. The flail leaflet makes the MR severe, even when the jet looks small and slow.
  3. A free-wall rupture bleeds into the pericardium and causes tamponade. A contained rupture forms a pseudoaneurysm, with a neck at most 0.5 of the sac's width.
  4. A true aneurysm has a wide mouth and a wall of thin scar; up to 50% of chronic aneurysms hold a thrombus.

Shunts: ASD, VSD and PFO

Septal defects, Qp/Qs and the saline study

A septal defect or a patent foramen ovale lets blood pass between the left and the right heart. Echocardiography shows the defect and its flow, measures Qp/Qs, and grades its effect on the chambers and the pulmonary pressure. Across a restrictive atrial communication, the shunt velocity gives the LA pressure.

Defect

Atrial septal defect

Secundum defects, at the fossa ovalis, make up 80% of ASDs; sinus venosus defects in general require TEE. The shunt is in general relevant from a defect size of 10 mm. RV volume overload is the key finding, and it characterizes the hemodynamic relevance of the defect better than the shunt ratio. The RA and the RV dilate, and the ventricular septum flattens in diastole (chapter 13).

The subcostal four-chamber view is preferred: the septum lies nearly perpendicular to the beam, so a true defect is told from dropout and measured. In the apical four-chamber view the septum lies parallel to the beam, so an ASD should not be diagnosed or measured there; that view shows the RA and RV dilation and gives the RV pressure from the TR jet. The diameter is measured without color, which can overestimate the defect, and the color scale is lowered to 25–40 cm/s for the low-velocity shunt flow.

Ventricular septal defect

Perimembranous defects, next to the tricuspid and aortic valves, make up 80% of VSDs. CW Doppler through the defect gives the LV–RV gradient as 4V², and the RV systolic pressure is the LV or aortic systolic pressure minus that gradient. The figure takes a systolic blood pressure of 125 mmHg for the aortic systolic pressure.

A small VSD with an insignificant left-to-right shunt, no LV volume overload and no pulmonary hypertension is restrictive, and its jet is fast. A large shunt loads the LA and the LV with volume. The figure calls the LV enlarged above an LVEDD of 58 mm and the LA above a volume index of 34 mL/m², the upper limits of normal for men. Aortic regurgitation from cusp prolapse should be sought, especially with outlet and high perimembranous defects.

Qp/Qs and closure

Qp/Qs is the RVOT stroke volume ÷ the LVOT stroke volume (chapter 08), and the calculation can have an error of up to 20%. A shunt is hemodynamically significant when the chambers distal to it are enlarged and/or Qp:Qs is 1.5:1 or more; otherwise it is small or trivial. The figure takes the RV basal diameter as the chamber for an ASD, and the LVEDD for a VSD.

The AHA/ACC guideline recommends closure of an isolated secundum ASD that impairs functional capacity, with RA and/or RV enlargement and a net left-to-right shunt with physiological sequelae (for example Qp:Qs of 1.5:1 or more) without cyanosis; in an adult without symptoms but with these findings, closure is reasonable. It recommends closure of a VSD with LV volume overload and a Qp:Qs of 1.5:1 or more. For both, the condition is a systolic PA pressure below 50% of the systemic pressure and a pulmonary vascular resistance below one third of the systemic resistance; with a VSD and a systolic PA pressure of 50% or more, closure may be considered. An ASD should not be closed with a systolic PA pressure or a pulmonary vascular resistance above two thirds of the systemic value, and/or a net right-to-left shunt. In an ASD, a calculated systolic PA pressure above 40 mmHg requires catheterization to measure the pulmonary vascular resistance.

Patent foramen ovale and the saline study

Agitated saline forms microbubbles too large to pass the normal pulmonary vessels, so bubbles in the left heart have crossed a shunt. Bubbles in the LA within 3–6 beats of the first beat with the RA and the RV fully opacified indicate an intracardiac shunt such as a PFO; later bubbles, from the pulmonary veins, indicate an intrapulmonary shunt such as an arteriovenous malformation.

A Valsalva maneuver or a cough is usually needed to show a PFO that does not shunt at rest. The strain is released when the contrast arrives in the RA; a shift of the atrial septum toward the LA at the release shows that the RA pressure exceeded the LA pressure. An inadequate Valsalva maneuver or RA opacification gives false negatives, and TEE is the reference standard. The number of bubbles in one frame depends on the contrast injected and the maneuver. In patients aged 18 to 60 years with a prior PFO-associated stroke, the SCAI guideline recommends PFO closure rather than antiplatelet therapy alone.

LA pressure from an atrial shunt

A restrictive atrial communication keeps a pressure difference between the atria. Across it, CW Doppler gives the LA–RA gradient as 4V², so the LA pressure is the RA pressure + 4V². After transseptal mitral edge-to-edge repair, the mean gradient + the central venous pressure gave the mean LA pressure, and the peak gradient + the RA pressure gave the peak LA pressure, with limits of agreement of −6.2 to +3.1 mmHg. Both studies used TEE and a catheter RA pressure. On TTE the RA pressure comes from the IVC (chapter 07), and its error adds directly to the LA pressure.

A large ASD lets the atrial pressures equalize: in ASD the mean transatrial septal velocity was 41 ± 11 cm/s, a gradient of about 1 mmHg, so the shunt cannot show a raised LA pressure. A PFO can shunt left to right when a left-sided lesion raises the LA pressure: in one series, every PFO that did had an LA pressure above 13 mmHg and an LA–RA gradient above 10 mmHg.

The figure takes a 5-mm communication and an RA pressure of 3 mmHg, from a normal IVC, and its slider sets the mean LA pressure; the pressure waveforms are teaching values. It calls a mean LA pressure above 15 mmHg raised, the cut-off for an abnormally elevated LV filling pressure in the study that validated the algorithm of chapter 10.

Key points

  1. An ASD is measured in the subcostal four-chamber view. A shunt is hemodynamically significant when it enlarges the chambers distal to it and/or Qp:Qs is 1.5 or more.
  2. Across a VSD, the RV systolic pressure is the systemic systolic pressure minus 4V² of the jet.
  3. On the saline study, LA bubbles within 3–6 beats of full RA opacification indicate an intracardiac shunt such as a PFO; Valsalva release can show a shunt absent at rest.
  4. Across a restrictive atrial communication, the LA pressure is the RA pressure + 4V²; across a large ASD the atrial pressures equalize.

Right ventricle

RV size and function, pressure and volume overload, acute pulmonary embolism

The RV is assessed by its size, its systolic function and the pressure that it generates. The septum flattens at end-systole in pressure overload and at end-diastole only in volume overload; in acute pulmonary embolism the RV dilates while its wall stays thin.

Overload
Frame

RV size

The RV is measured at end-diastole in the RV-focused apical four-chamber view; at least one measure of RV size, typically the basal diameter just beneath the tricuspid annulus, should be reported. In the four-chamber view, the RV is normally no more than two-thirds the size of the LV, and the LV forms the apex.

  • The RV basal diameter is normal below 4.1 cm, mildly dilated at 4.1–4.4 cm, moderately at 4.5–4.9 cm and severely above 4.9 cm.
  • The RV free wall is normally thinner than 5 mm at end-diastole; a thick wall is not specific, as it occurs in pulmonary hypertension and in infiltrative and inherited cardiomyopathies.
  • The RV area is normal below 25 cm² at end-diastole and below 14 cm² at end-systole.
  • The RA area at end-systole is normal below 19 cm².

RV systolic function

The ASE guideline grades these measures of RV systolic function:

  • TAPSE. TAPSE is the M-mode excursion of the lateral tricuspid annulus toward the apex. It is normal above 17 mm.
  • S′. S′ is the systolic tissue Doppler velocity of the same point. It is normal above 9.5 cm/s.
  • Fractional area change. The fractional area change (FAC) is (end-diastolic area − end-systolic area) ÷ end-diastolic area. It is normal above 35%.
  • Free-wall strain. The longitudinal strain of the RV free wall is normal when it is more negative than −20%.

TAPSE and S′ measure the motion of one point of the annulus; FAC comes from the whole RV area in one plane, and so includes the radial motion of the free wall and the septum. In a pressure-overloaded RV that has begun to fail, the base often keeps its motion, so TAPSE and S′ can overestimate RV function.

Pressure overload

The RV systolic pressure is 4 × the peak TR velocity² + the RA pressure (chapter 08), which comes from the IVC (chapter 07); it equals the PA systolic pressure when there is no RVOT obstruction or pulmonic stenosis. The ASE guideline grades it as normal up to 34 mmHg, mildly raised at 35–49 mmHg, moderately at 50–69 mmHg and severely at 70 mmHg or more.

As the resistance of the pulmonary vessels rises, the RVOT acceleration time, normally above 105 ms, shortens, and the RVOT flow can notch in mid-systole, the W sign.

The RV first adapts with concentric hypertrophy and a preserved ejection fraction. When it maladapts, it dilates, its function falls and its shape changes from a crescent to a sphere; the tricuspid annulus can then dilate, with functional TR.

Volume overload

Significant TR or PR, an atrial septal defect and anomalous pulmonary venous drainage put a volume load on the RV, and the right heart dilates. In severe TR, the TR velocity can underestimate the RV–RA gradient (chapter 18).

The septum

The LV eccentricity index (LVEI) is the ratio of two diameters of the LV in the short axis at the papillary muscles: D2, parallel to the septum, over D1, from the septum across the LV. In a normal heart the LV is round, and the index is about 1 at end-diastole and at end-systole.

  • An index above 1 at end-diastole only suggests RV volume overload.
  • An index above 1 at end-systole suggests RV pressure overload.
  • An index above 1 at both times suggests RV pressure overload, with or without volume overload.

Conduction abnormalities, pacing, cardiac surgery and constriction can change the motion of the septum.

Acute pulmonary embolism

Acute pulmonary embolism puts a sudden pressure load on an RV that has not hypertrophied: it enlarges before the pulmonary pressures rise, and its wall thickens only later. The ESC guideline shows the signs of RV pressure overload: a basal RV/LV diameter ratio above 1.0, a flattened septum, a distended IVC with less inspiratory collapse, a TAPSE below 16 mm, an S′ below 9.5 cm/s, the 60/60 sign, McConnell's sign and a mobile thrombus in the right heart.

McConnell's sign is akinesia of the mid RV free wall with normal motion at the apex; in the first series, the mid free wall moved −0.2 ± 0.8 mm. The 60/60 sign is a pulmonary ejection acceleration time, measured in the RVOT, below 60 ms with a peak systolic TR gradient below 60 mmHg. Both signs are specific but insensitive; pooled over 11 studies, McConnell's sign had a sensitivity of 29.1% and a specificity of 98.6%. McConnell's sign also occurs in RV infarction (bonus chapter B6); signs of RV pressure overload help to distinguish acute PE from RV infarction.

A peak TR velocity above 3.8 m/s, a TR gradient above 60 mmHg or a thick RV wall goes beyond what an acute pressure load produces, and chronic thromboembolic or other pulmonary hypertension should then be considered. The figure's pressure load is that chronic picture: its RV wall thickens to 9.5 mm and its TR velocity reaches 4.4 m/s on the normal heart, against 4.0 mm and 3.3 m/s or less under acute PE.

Echocardiography is not mandatory in a hemodynamically stable patient with suspected PE, and a normal study does not exclude PE: its negative predictive value is 40–50%. In suspected high-risk PE with hemodynamic instability, the absence of RV overload or dysfunction practically excludes PE as the cause. Unequivocal RV pressure overload with no other obvious cause justifies emergency reperfusion when CT angiography is not feasible, in a patient with a high clinical probability. An RV/LV ratio of 1.0 or more and a TAPSE below 16 mm are the findings most often linked to an unfavorable prognosis; the grades of the figure are echocardiographic findings, not risk classes.

Key points

  1. At least one measure each of RV size, typically the basal diameter, and of RV function should be reported.
  2. The septum flattens at end-systole in pressure overload and at end-diastole only in volume overload.
  3. In a failing, pressure-overloaded RV, TAPSE and S′ can overestimate RV function; FAC also shows the radial motion of the free wall and the septum.
  4. In acute pulmonary embolism the RV dilates while its wall stays thin and the TR gradient stays at 60 mmHg or less. McConnell's sign and the 60/60 sign are specific but insensitive, and a normal echocardiogram does not exclude PE.

Transesophageal echocardiography

The probe, its movements and the standard views

Transesophageal echocardiography (TEE) images the heart from the esophagus and the stomach, directly behind the left atrium. Each standard view is set by the level of the probe, its turn and the multiplane angle.

Level
Turn

The probe and its movements

The probe tip is advanced into the esophagus or the stomach, or withdrawn. Rotating the probe clockwise, toward the patient's right, is turning to the right; rotating it counterclockwise is turning to the left. The large control wheel flexes the tip anteriorly (anteflexion) or posteriorly (retroflexion), and the small wheel to the patient's right or left. Buttons on the handle rotate the imaging plane electronically from 0° to 180°: toward 180° is forward rotation, toward 0° backward rotation. The basic examination uses three positions: the upper esophageal (UE), the mid-esophageal (ME) and the transgastric (TG) level. The transthoracic views are in chapter 04.

Image orientation

The transducer is at the top of the image, with the near field close to it. At 0°, the transverse plane, the patient's right appears on the left of the display. Forward rotation to 90°, the longitudinal plane, moves the left of the display inferiorly. At 180°, the image is the mirror image of 0°. From the mid-esophagus, the LA lies in the near field. An icon on the screen shows the angle.

The standard views

The ASE/SCA guideline describes 28 views of a comprehensive examination, each with its level, approximate angle, probe movement from the previous view and the structures imaged. Flexion or turning may be needed in a given patient. The basic perioperative examination uses 11 of the views and starts in the ME four-chamber view. The figure shows 17 views, including all 11 basic views.

  • Mid-esophageal, neutral. From the four-chamber view at 0–10°, forward rotation gives the mitral commissural view at 50–70°, the two-chamber view at 80–100° and the long-axis view at 120–140°. The long-axis view has the orientation of the transthoracic long-axis or three-chamber view.
  • Mid-esophageal, turned right. In the aortic valve short-axis view at 25–45°, the left coronary cusp lies in the near field on the right of the display, the noncoronary cusp next to the atrial septum and the right coronary cusp in the far field. The RV inflow-outflow view lies at 50–70°, the bicaval view at 90–110° and the aortic valve long-axis view at 120–140°.
  • Mid-esophageal, turned left. From the two-chamber view at 90–110°, turning to the left gives the LA appendage view. Advancing or anteflexing the probe may open the appendage, and the left upper pulmonary vein often shows in the same view.
  • Upper esophageal. The ascending aorta appears in long axis at 90–110°, with the right pulmonary artery behind it, and in short axis at 0–30°. Table 10 of the guideline gives these two ME views the upper esophageal level. Higher, the aortic arch appears in long axis at 0–10° and in short axis at 70–90°.
  • Transgastric. The anteflexed probe shows the LV in short axis at the papillary muscles at 0–20°, with myocardium of the left anterior descending, circumflex and right coronary arteries together. At 90–110°, the TG two-chamber view shows the anterior and inferior walls.
  • Descending aorta. Turned to the left, the probe shows the descending aorta in short axis at 0–10° and in long axis at 90–100°. It lies posterior to the esophagus and to its left.

What TEE adds to transthoracic imaging

TEE is indicated when its findings will change management and TTE is nondiagnostic, or likely to be. TTE may be nondiagnostic for far-field structures, such as the aorta and the LA appendage, and for prosthetic valves, native valve masses and paravalvular abscesses. The guideline rates TEE as appropriate in suspected acute aortic pathology, including dissection, and in suspected endocarditis with a moderate or high pretest probability. Chapter 21 covers aortic dissection, bonus chapter B2 prosthetic valves and bonus chapter B3 endocarditis.

The LA appendage is the primary target in the search for a cardiac source of embolus. TEE detects appendage thrombus with a sensitivity of 100% and a specificity of 99%, but thrombi smaller than 2 mm can be missed. In the ACUTE trial, in atrial fibrillation of more than two days, early cardioversion guided by TEE had an embolic rate similar to that of cardioversion after 3 weeks of warfarin, with fewer hemorrhagic events.

In an agitated saline study, more than three bubbles in the left heart within three beats of right heart opacification are most consistent with a patent foramen ovale. Bonus chapter B4 shows the shunts.

The interactive figure

The left pane shows the heart model from the patient's left, with the esophagus behind the LA, the probe at its level and its imaging plane. The right pane shows the echo image that the plane cuts from the same mesh, in the guideline's orientation. The Level and Turn switches move the probe, and the slider rotates the plane from 0° to 180°; when it stops near the angle of a view, it snaps to that view. Between two views of one level and turn, the probe moves from one view's position to the other's.

The Free probe switch releases the probe. Four sliders then advance or withdraw it along the esophagus, turn it, ante- or retroflex it and flex it to the side. With the probe free, the multiplane angle turns the plane about the beam, and the probe does not move. The panel names the nearest standard view, with the difference in degrees and centimeters.

The esophagus runs behind the LA of each heart and to the right of the descending aorta, then through the hiatus to the stomach under the LV. In this model, the probe is retroflexed and flexed to the right to show the four-chamber plane at 5°. The mesh's descending aorta ends a little above the hiatus, so for the aortic views the probe lies behind the LA, where the aorta crosses the whole sector.

Key points

  1. The probe is advanced or withdrawn, turned right or left, and flexed; the imaging plane rotates electronically from 0° to 180°.
  2. The transducer is at the top of the image. At 0° the patient's right is on the left of the display, and 180° gives the mirror image.
  3. The basic perioperative examination uses 11 views and starts in the ME four-chamber view.
  4. TEE shows structures that TTE may not: the LA appendage, the aorta, prosthetic valves and abscesses.

Chapters

    Sources

    Each guideline value on this page is cited to its source. The cut-off values are taken from the American Society of Echocardiography (ASE), the European Association of Cardiovascular Imaging (EACVI), the British Society of Echocardiography (BSE), the ACC/AHA, the ESC and the ESC/ERS.

    The figures are generated by simple models calibrated to agree with these sources. The diastolic values and the Doppler and strain values of the amyloid heart are illustrative and are not patient data. All images are simulated, including the drawings, the heart model and the echocardiographic views.

    Sources, in reading order

      Normal values